
Value function for continuous variable
Value function used for proportions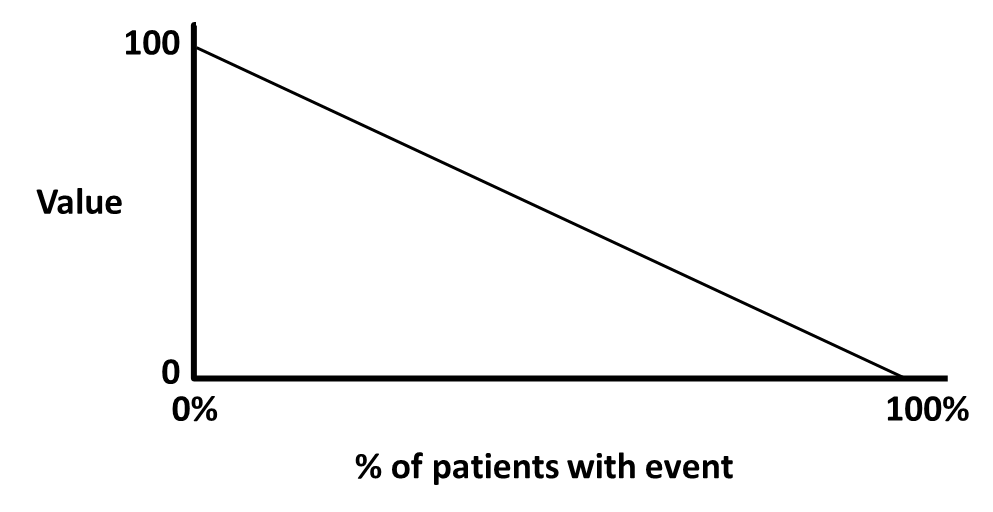
| Short name | Description |
|---|---|
| Name/rubric | Line graph of preference values against a binary event (proportions of patients with an event) |
| Created in | Microsoft Word Draw facility. Can also be created in most packages |
| Message | To show the relationship between preference value and data for one isolated parameter, under linear map assumption of the value function. The representation is unclear, especially when compared to a similar figure in 7.4.2 which includes flow chart for more context and information. |
| Intended audience | Statisticians, Regulators, not for Physicians or Patients |
| Knowledge required | Needs in depth knowledge of MCDA and value functions. Knowledge of the parameter/endpoint on horizontal axis and its plausible values are also required. |
| Unintentional message | There is no inclusion of sensitivity or uncertainty aspects which are likely to be associated with individual¡¯s preference. The aspect ratio of less than 1 (longer vertical axis than horizontal axis), may be perceived as increase in 1% of patients with event translates to less than 1 unit increase in preference value when they actually equal to the same amount.. |
| Message not communicated | Value function for other benefits and risks criteria are not shown but could easily be produced. There is no explanation whether the value function refers to active treatments or placebo, or is the same for all treatments. It is beneficial to focus further on the likely range of values on the horizontal axis (data values) and the justifications for range of values choice. |
| Proposed improvement | The value function should be provided for all key parameters. A text explanation to justify the use of a linear value function is needed for transparency. |