
Introduction to the benefit-risk assessment roadmap
Under the umbrella of the IMI-PROTECT, we have advanced the understanding of both the integration and visual representation of benefit and risk data. Following a robust review of the literature, selected methodologies and visualisation techniques were applied in several case studies, each one constructed from publicly available data and representative of the more challenging benefit-risk assessments encountered throughout the life cycle of a drug.
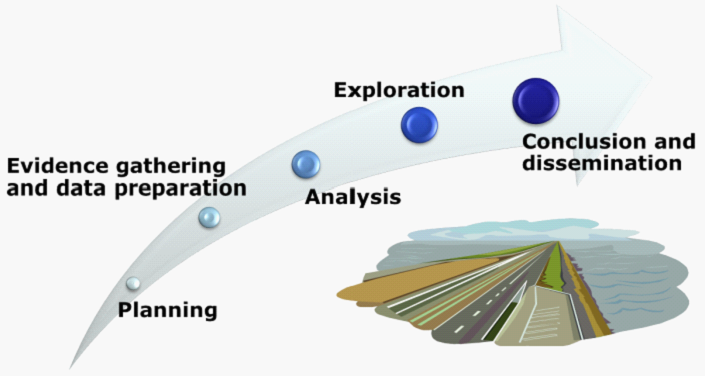
The experience of the case study teams has been distilled into a clear set of practical recommendations for benefit-risk decision processes and supporting tools, and these are organised around the five stages of a generic benefit-risk assessment roadmap (Figure 1).
Figure 1 Benefit-risk assessment roadmap
- Planning: This stage encourages stakeholders to focus on critical issues related to benefit-risk assessment, including the purpose and context of the assessment. Clear documentation of discussions allows future analyses and updates to utilise the same foundations.
Useful methodologies included frameworks, such as the Benefit-Risk Action Team (BRAT) and Problem, Objectives, Alternatives, Consequences, Trade-offs, Uncertainty, Risk and Linked decisions (PrOACT-URL) frameworks that organise data, with tree diagrams and structured tables providing useful means of visualisation.
- Evidence gathering and data preparation: This stage identifies data sources and extracts evidence relevant to the benefit-risk assessment, and may include aggregation of multiple sources of evidence, which may require the use of estimation techniques. It encourages the systematic handling of missing data and requires engagement of clinical, statistical, epidemiological, and database expertise.
Useful methodologies include Indirect/Mixed Treatment Comparison (ITC/MTC) and Probabilistic Simulation Method (PSM), and visualisation techniques such as structured and colour-coded tables, and network graphs to enhance the communication of data.
- Analysis: In this stage, the data are evaluated, quantifying the magnitudes of benefits and risks, and perhaps weighing and/or integrating favourable and unfavourable effects as required by a given approach.
Useful methodologies for analysis include metric indices which provide numerical representations of benefits and risks (Number Needed to Treat (NNT) / Number Needed to Harm (NNH), Impact numbers), quantitative frameworks which model benefit-risk trade-off and balance benefits and risks (Multi-Criteria Decision Analysis (MCDA), Stochastic Multi-criteria Acceptability Analysis (SMAA)), and utility survey techniques which elicit stakeholders' preference information (Discrete Choice Experiment (DCE)).
Visualisations recommended for the analysis stage include visualisation techniques specific for eliciting value preferences (tree diagram, method-specific visualisations such as MACBETH grid, Analytic Hierarchy Process (AHP) table, swing-weighting 'thermometer' scale, drop-down list), and visualisations for presenting analysis results (tables, forest/interval plots for qualitative or partially quantitative analyses; 'Difference display' (MCDA), and stacked or grouped bar charts for quantitative analyses).
- Exploration: This stage assesses the robustness and sensitivity of the main results to various assumptions and sources of uncertainties, considers impact or added value of risk minimisation measures, and likely requires both statistical and clinical input.
Useful methodologies include ITC/MTC, utility survey techniques (DCE, AHP, Swing-weighting, MACBETH), PSM, and SMAA. Preferred visualisation techniques include the box, distribution, scatter, and forest/interval plots; tornado diagram; and most importantly, techniques that are interactive with the user.
- Conclusion and Dissemination: This is the point at which, after considering all the information in the previous four stages, a conclusion is reached. The results and consensus from the benefit-risk assessment are then explicitly communicated to a wider audience, providing a transparent audit trail of the whole assessment process and bringing all aspects together in a holistic fashion. The content of the communication and visualisation methods used should match the needs of the intended audience.
However, it is of vital importance that the reader appreciates the overlapping and iterative nature of the key benefit-risk assessment stages. Those carrying out a benefit-risk assessment will inevitably find that tasks initially tackled at the earlier stages need to be revisited in light of what is revealed later on. Equally, choices made in the early stages of the benefit-risk assessment process should be guided by knowledge of the data, resources, and methods that will be available further down the line. In other words, it is important to take a holistic view and an iterative approach to the entire benefit-risk assessment process - and to accept that some steps may need to be revisited and refined in an iterative fashion - rather than concentrating on each stage of the process in isolation.
While no single benefit-risk methodology can fully capture all aspects of a benefit-risk assessment, the choice of a single approach or combination of methodologies should be matched to the complexity of the problem. Application of a simple descriptive framework can provide a clear and easily communicable benefit-risk assessment, could be sufficient for the majority of benefit-risk problems, and can be enhanced for clarity with varying degrees of quantification. For more complex problems, a framework supplemented by quantitative models can facilitate consideration of trade-offs amongst the benefits and risks, address uncertainty, and potentially lead to a more comprehensive overall assessment. To understand the perspective of a particular stakeholder, elicitation of preference values for weighing benefits and risks may be required.
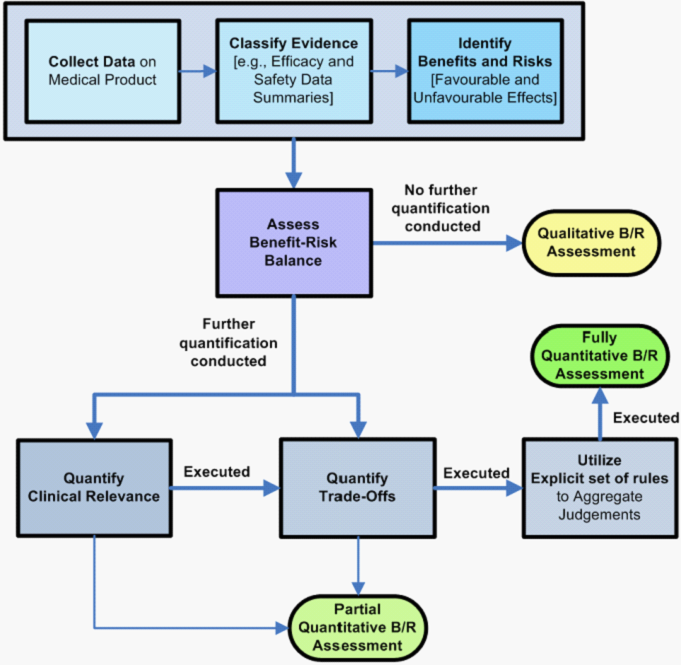
Figure 2 below provides a graphic statement of the distinctions we used throughout our recommendations to classify a benefit-risk method or approach as qualitative, partially quantitative, or fully quantitative. All three categories presume that data have been collected and summarised, and the relevant benefits and risks have been identified. The subsequent paths in the diagram, ending in the ovals, depend on whether or not judgments about clinical relevance and trade-offs have been quantified, and judgements aggregated using a mathematical rule.
NOTE: The graphic serves only to make explicit our working principles for classifying the methods we examined; It does not represent the full process of making a benefit-risk assessment of a medicinal product.
Figure 2 Distinctions of qualitative, partially-quantitative and fully-quantitative benefit-risk assessment