-
Planning: Summary of Key Points
Planning
In any decision analysis, let alone benefit-risk assessment in medicine, the actual question to be answered by the analysis needs to be clearly specified upfront. Together with good planning, this is required so that stakeholders can agree on the type and thoroughness of the assessment required for their decision maker needs. It also encourages value-focused thinking (Keeney, 1992), which is an approach designed to focus decision makers on the critical issues. This includes well clarified objectives, creative options, the key facts, and the most relevant uncertainties. It thereby helps optimise resource utilisation within an analysis (French et al., 2009).
The benefit-risk assessment process is initiated with planning so that:- sufficient thinking and thorough discussions between stakeholders are undertaken to clearly define the purpose and context of the benefit-risk assessment;
- these discussions and their results are documented in such a manner that clearly summarises the details to allow evidence to be traced back to its source; and
- future analyses and updates can utilise the foundations of the analysis.
Summary of key points
It is recommended to agree with stakeholders on the purpose and type of assessment required so that the analysis is efficient and the result valid.
Appropriate comparators can be a different dose, another active pharmacological or other non-pharmacological treatment, or no treatment.
Depending on the analysis perspective, different risks and benefits may be included, or different weights of importance assigned. When describing and interpreting the results, any impact of the perspective taken on the benefit-risk balance should be acknowledged.
Two descriptive frameworks, BRAT and PrOACT-URL, have been found useful to facilitate structured and consistent approaches as they help select, organise, summarise, and interpret data and preferences.
In any analysis, a hierarchical visualisation, often called "value-tree," should be built to help list and organise all benefits and risks considered. Whilst initially all benefits and risks of potential relevance should be taken into account, an iterative process is recommended to highlight those with limited evidence or impact, and to then focus on those benefits and risks with potential impact on the benefit-risk balance. A clear record of which effects were included and excluded needs to be kept for transparency.
A critical recommendation at the Planning stage is to examine possible sources of double-counting, e.g., counting the percentage of patients experiencing an event within 12 months, as well as those experiencing an event within 24 months. Eliminating double-counting can be a challenge but is critical to the validity of an analysis. It is also recommended that a table template ("effects table" or "source data table") is prepared in order to represent the data that are required to be collected. Different time horizons can be established for different benefits and risks depending on what is considered to be the expected duration of each effect. Including patient preferences is seen as an important objective by many stakeholders. Extensive and forward planning is required to elicit preferences directly from patients. -
What key points should be documented at the Planning stage of a benefit-risk assessment?
What key points should be documented at the Planning stage of a benefit-risk assessment?
The Planning stage is where the decision situation and its context are outlined to provide the starting point for the subsequent data extraction and analysis.
This is done by identifying and documenting the following details that are fundamental to the decision and the evidence supporting the analysis. A more comprehensive description is available within the PrOACT-URL framework (Mt-Isa et al., 2012).
The decision problem
The most fundamental point to address is the nature of the decision for which a benefit-risk assessment is needed. In the case of a medicinal product, the decision usually relates to a specific point in the product's life cycle and may be triggered by a request from the regulatory authorities. For example, the aim may be to decide:
- whether a drug in early-phase trials should undergo further development
- whether a drug in development should be transitioned to the next phase
- whether a drug in development should be continued when a significant safety signal is detected
- whether additional studies or endpoints should be used to evaluate the benefit-risk balance
- whether an optimal Risk Management Plan (RMP) would maintain a positive benefit-risk assessment
- whether an emerging safety risk in the post-marketing period has shifted the benefit-risk balance and whether a healthcare provider should continue using it (this was the question underlying several of our case studies)
- whether another treatment alternative could replace an established treatment based on its benefit-risk assessment (this was considered in the Wave 2 warfarin case study)
- planned safety reports such as Periodic Safety Reports (e.g., Periodic Benefit-Risk Evaluation Reports (PBRERs) and Development Safety Update Reports (DSURs))
Being clear about the purpose of a benefit-risk assessment helps to ensure that appropriate comparators, benefits and risks, perspectives, and sources of evidence are adopted and used.
It is good practice to thoroughly consider and document the following factors in the decision context during planning: the treatment under investigation, its indication(s) and therapeutic action, unmet medical needs, the target population(s), and the assumed time horizon for the impact of the benefits and risks. The identity of the decision maker (i.e., the entity ultimately responsible for the decision) should also be mentioned.
Comparators
Benefit-risk assessment is comparative in nature and usually involves weighing up the benefit-risk balance of a medicinal product compared to one or more alternatives.?? The assessment may compare a medicine's effects at one dose compared to a different dose, against a placebo, or against another active pharmacological or non-pharmacological treatment. Consideration is often given to standard of care and the impact of no treatment.
The choice of comparator(s) depends on the purpose of the assessment. For example, a drug may pass early phase trials if it appears to have a favourable benefit-risk profile compared to placebo or no treatment. However, later in a product's life cycle, it has been suggested that it may be more appropriate to compare the drug with other available treatments (or treatments that are anticipated to be available in the near future) for the same indication (Wave 2 warfarin case study).
Benefits and risks
The benefit and risk measures to be included in (or excluded from) the analysis must be identified and justified. The choices of measures should reflect the strength of evidence, clinical relevance, generalisability, duration of effect, reversibility of risk, preventability, and public health impact (ICH E2C (R2) Guideline). This is a crucial and often difficult step. The basic consideration is to include only those measures that could affect the benefit-risk balance. For example, minor infections that do not require hospitalisation might not be included, while serious infections that would require hospitalisation could be included. If in doubt, include an effect; it can be deleted later if its inclusion was shown to have no effect on the benefit-risk balance.
Depending on a medicine's life cycle, information on its potential benefits and risks can be found in different sources. Some examples are shown in Table 1 below, and the list is not intended to be exhaustive. It is important for effective quantitative modelling to only include measures of benefit and risk that are relevant to the decision to be made (Phillips, 1986).
Table 1 Information sources to identify the types of benefits and risks to include
Timepoint of analysis Information source Phase II or Phase III trials - Results of earlier trials
- Clinical and pharmacological data
Post-marketing - Post-marketing safety and efficacy studies, including extension studies
- Non-interventional (observational) studies
- Ad-hoc case reports
- Registration documents
- Periodic safety reports
- Literature searches
Treatment benefits are normally given precise definitions within clinical studies, whereas risks are often defined using Medical Dictionary for Regulatory Activities (MedDRA) terms, some of which are very broad (e.g., arrhythmia), others relate to more specific conditions (e.g., Wolff Parkinson White syndrome), or by highly defined events (e.g., fatal myocardial infarction). An analysis team needs to judge which is the level of precision that is required, and to ensure that there is minimal overlap between the definitions and that the data chosen (during the Evidence Gathering and Data Preparation stage) can appropriately reflect these benefit and risk definitions.
As an example for overlap, suppose a decision maker is interested in an individual's risk of ST elevated myocardial infarction (STEMI) in connection with a particular treatment. A clinical trial has been carried out, recording the number of acute coronary syndrome (ACS) events and STEMIs in a group of patients given the drug. To use both measures in a decision model would mean double counting the STEMIs, giving these events undue weight in the analysis (as they are included in both statistics) (refer to the Wave 1 efalizumab case study for another example of overlap relative to the PASI data). Also, to use only the number of patients experiencing ACS events may involve double counting some patients and thereby overstating the risk, as each patient may have suffered more than one event. In this example, the analysis team may decide to use the STEMI statistic, but perhaps this figure is not shown in the published report of the trial, so the team may instead choose to use the risk of cardiovascular events as a surrogate to represent STEMIs - but only if there are no other cardiovascular risks to consider, as this may also lead to double counting.
In addition to the above example, some measures (e.g., decrease in bleeding) could appear either as a risk or as a benefit, depending on the state of the patient experiencing them, and therefore need to be evaluated for the potential of double-counting.
As a conclusion, to avoid both double counting and the omission of key measures, it is helpful to take a holistic view across all benefits and risks rather than defining measures in isolation. Our practical experience of identifying benefits and risks is summarised in the section on constructing value trees.
Perspectives
A patient considering whether to take a medication and a regulator deciding whether to make a medicine available to a certain patient population may arrive at different preferred choices, even if the options available and the evidence considered are identical.
For example, in the assessment of vaccination decisions, the protection conferred by a sufficient degree of protection in a population (the so-called "herd-immunity" effect) will always be of importance to a public health decision maker, but may carry less weight for an individual patient when assessing whether or not to receive a vaccine.
The perspectives should be made explicit at the beginning of the benefit-risk assessment process, and the following questions should be answered:- who the decision maker is (the first party)
- who the decision is to be made for (the first or the second party), and
- any other stakeholders involved (the third party) in the decision making.
Care should be taken to ensure that second or third party perspectives are not adopted in a way that would interfere with the framing of the decision problem. This is not to say, however, that other perspectives cannot be taken on board. For example, in the Wave 1 natalizumab case study, the decision was framed from a regulatory perspective, but clinicians' advice was sought when selecting the benefit and risk outcomes, and patient representatives were involved in assigning preference weights.
Different stakeholders may prefer specific ways of formulating a set of choices and the context around these choices, and assign different weight of importance to the benefits and risks considered.
Different stakeholders may have different views on the benefits and risks criteria to be included in an analysis, and their relative importance. For example, clinicians may consider a particular prognostic biomarker to be a worthwhile endpoint, but from a patient's perspective, it may be impossible to appreciate the meaning and clinical usefulness of this endpoint to their individual situation. Therefore, we recommend to highlight which benefits and risks may be of relevance to different stakeholders and how this impacts the benefit-risk balance. In addition, the analysis should explicitly describe how the benefit-risk balance can differ between subgroups (e.g., infants and children; adults and elderly; male and female; pregnant or not pregnant).
Although patient involvement in regulatory decision making is increasingly seen as a priority, regulatory authorities will need to identify resources in order to evaluate patient preferences, and require expertise in the interpretation and incorporation of patient preference values into their regulatory assessment of a medicine. In an ideal case, regulatory agencies would take into account patient preferences at the same time as considering public health perspectives that reach beyond the interest of an individual patient.
Sources of evidence
At this stage, it is also helpful to look further ahead and begin considering the type and quantity, as well as summary level or patient level, of data that are available for the treatment of interest and its comparators, together with the metrics and quantitative methods that will be used for analysis. The choice of analysis (which is often guided by the resources available) may to some extent determine the data that are required; whether or not these data are available can, in practice, influence many aspects of planning, such as identifying the benefits and risks, comparators, and time horizon. Allowing the use of several sources within one analysis usually carries the risk of bias and errors, and requires modelling assumptions that should be transparently documented, i.e., if pooling results from studies with varying designs
Resources
The time and expertise resources available for a benefit-risk analysis should be considered at the Planning stage. Data extraction and analysis may require varying amounts of statistical expertise depending on how they are performed. This can influence both the methods that are deployed and the practical aspects such as timelines and budgets.
Particularly, extensive and forward planning of resources is needed if data are to be collected directly from patients. For example, the Wave 2 natalizumab case study team found that more time than anticipated was needed to recruit a sample of patients for a planned preference elicitation exercise.
Time horizon
Another question to consider is how to determine the appropriate time horizon for measuring the occurrence of benefits and risks, and the often far longer (sometimes lifetime) horizon for the impact of these. For acute effects or short-term treatments without long-term consequences, only a short time horizon may be necessary, but in other cases, it may be desirable to extend the time horizon as far as possible. In practice, this is often challenging due to the data that are available. In particular, long term follow-up for safety, versus after a blinded efficacy and safety study, creates imbalances in that regard. Where data have been collected over a relatively short study-period for benefits and risks expected to impact the future, modelling may be helpful in understanding the longer-term impact of a medication.
The time horizon should be included as appropriate in the documented definitions of benefits and risks. Different time horizons can be established for different criteria depending on what is considered to be the clinically relevant timeframe for each benefit and risk.
-
What types of methodologies are available to help with the Planning stage?
What types of methodologies are available to help with the Planning stage?
Descriptive Frameworks provide a structured, consistent approach to decision making by facilitating the selection, organisation, summarisation, and interpretation of data and preferences relevant to the decision. Frameworks also serve as an aid to decision documentation and communication.
-
Which descriptive frameworks were identified and reviewed?
Which descriptive frameworks were identified and reviewed?
Eight Descriptive Frameworks were identified as:- ASF
- CMR CASS
- COBRA
- FDA BRF
- PhRMA BRAT
- PrOACT-URL
- SABRE
- UMBRA
As noted in the Methodology Review (Mt-Isa et al., 2012), we are aware of four descriptive frameworks under development. One framework is being developed by the FDA and is known as the FDA Benefit Risk Framework (BRF). FDA BRF aims at giving stakeholders, in this case the regulators, the "big picture" of the issues relevant to regulatory decision making, as well as being compatible with formal quantitative benefit-risk approaches (Jenkins, 2010).
Another framework is being developed by the CMR International Institute for Regulatory Science CASS group (CMR CASS) - Health Canada, Australia's Therapeutic Goods Administration, SwissMedic, and Singapore Health Science Authority. The initial CMR framework on benefit-risk assessment consists of a six-step process (Walker et al., 2009). The CMR CASS group tested the application of a similar framework (Liberti et al., 2010) by omitting the assessment of numerical scores and weights (Phillips et al., 2010). The CMR CASS has further evolved into the Consortium on Benefit Risk Assessment (COBRA) initiative and pursues a more qualitative approach to benefit-risk assessment (CIRS, 2012).
The Southeast Asia Benefit-Risk Evaluation Initiative (SABRE) is also set up to further share the knowledge and to establish common working grounds between drug regulators in the Southeast Asian region, but there are no details yet available.
COBRA and CASS (as well as PhRMA BRAT) also joined forces with the Unified Methodologies for Benefit-Risk Assessment (UMBRA) Initiative led by the Centre for Innovation in Regulatory Science (CIRS) "to provide a platform for the coordinated development of benefit-risk assessment methodologies that can be used internationally during the drug development and regulatory review and post-approval periods" (http://213.120.141.158/UMBRA). UMBRA aims to increase transparency, predictability, and consistency in the benefit-risk assessment process globally by establishing a consensus on a scientifically acceptable framework for decision making (CIRS, 2012).
It would be too premature at this stage to formally appraise or consider these frameworks for applications in their current form, but they should be considered in the future when more details are available.
Further details are provided on each of these frameworks in Appendices A.5.3 and A.5.4 of the Methodology Review (Mt-Isa et al., 2012).
-
Which descriptive frameworks were evaluated in the case studies?
Which descriptive frameworks were evaluated in the case studies?
Based on the results of the Methodology Review (Mt-Isa et al., 2012), two Descriptive Frameworks, PrOACT-URL and BRAT, were recommended to be taken forward for benefit-risk assessment methodologies. The EMA Benefit-Risk Methodology Project Work Package 2 report Table 4 (Phillips et al., 2010) provides a detailed review of both frameworks and their usefulness for benefit-risk assessments.
Created by representatives within the pharmaceutical industry, the stated intention of the BRAT framework was to serve as a general platform for benefit-risk assessment, adaptable for use by all stakeholders. BRAT proposed displaying the results as tabular output and graphical summaries, and that benefit-risk evidence should not be integrated but presented separately and individually, allowing the conclusions regarding the benefit-risk balance to be drawn outside of the framework or by the use of additional tools. This was consciously proposed to avoid the creation of single, summary statistics to characterise the overall benefit-risk profile.
PrOACT-URL (Hammond et al., 1999) is one of the earliest frameworks for decision making and has a long history in other fields such as operations research and ecological management. However, its application to medical benefit-risk decision making is relatively recent. The EMA Benefit-Risk Methodology Review project (European Medicines Agency, 2013a) has recommended the use of the PrOACT-URL framework for benefit-risk assessments in medicine and provided an adjustment of this framework to this context.
PrOACT-URL and BRAT both break down the assessment into a stepwise procedure. Such a breakdown is inevitably approximate, with fuzzy boundaries between some of the steps. Also, the process is iterative, and information that is uncovered during an investigation may lead to earlier stages of the process being revisited. Therefore, it would be inefficient to only follow each framework in a strictly linear fashion.
For similar reasons, the steps of the BRAT and PrOACT-URL frameworks do not map precisely onto one another. They are, however, set out individually below.
BRAT framework
- 1) Define the decision context
- 2) Identify benefit and risk outcomes
- 3) Identify and extract source data
- 4) Customise the framework
- 5) Assess outcome importance
- 6) Display and interpret key benefit-risk metrics
PrOACT-URL framework
- 1) Problem
- 2) Objectives
- 3) Alternatives
- 4) Consequences
- 5) Trade-offs
- 6) Uncertainty
- 7) Risk tolerance
- 8) Linked decisions
The PrOACT-URL and BRAT frameworks were used extensively in the case studies, as shown in Table 2.
Table 2 Descriptive frameworks tested in the PROTECT WP5 case studie
Case study BRAT PrOACT-URL WAVE 1 Efalizumab 
Telithromycin Natalizumab Rimonabant WAVE 2 Efalizumab Telithromycin Natalizumab Rimonabant -
What are our recommendations regarding the use of these descriptive frameworks
What are our recommendations regarding the use of these descriptive frameworks?
Both the PrOACT-URL and BRAT frameworks emerged as being useful and favourable through the review and application in the case studies, with all the case study teams remarking that the structure provided by these descriptive frameworks served as a useful guide for the benefit-risk analysis process and are considered suitable for use at any stage of a medicinal product's life cycle.
There are two main operational differences between BRAT and PrOACT-URL that were noted in several case studies:
- If trade-offs (i.e., weighing up outcomes against one another) are critical to the benefit-risk balance, then the standard BRAT approach may need to be supplemented by additional methods. For example, in the Wave 1 efalizumab case study, the trade-off between the risk of PML and the benefits of treatment turned out to be pivotal to the results but was not addressed by the BRAT framework. An additional metric index, the benefit-risk ratio (BRR), was used to assess the trade-off. A similar trade-off was crucial in the Wave 1 natalizumab case study, where a weighted net clinical benefit (NCB) approach was used in combination with the BRAT framework.
- Application of the BRAT framework was facilitated by a Microsoft Excel-based software tool. If populated with data, this could generate the benefit-risk summary table and interval plot visualisation. This software tool has limitations in the amount and type of data and metrics it can process, preferring benefits and risks to be expressed in terms of the relative frequencies of binary events, e.g., the proportions of patients achieving a given level of a favourable effect or of experiencing a defined side effect. However, it is often possible to customise the tool in order to address these limitations. For example, the Wave 2 natalizumab case study expressed a benefit (reduction in relapses) as a rate rather than as a proportion, but a simple mathematical model allowed the transformation of the data into the required form for the generation of the BRAT framework-associated visualisations.
The Wave 1 rimonabant case study team found that the implementation of the BRAT framework was overall easier than PrOACT-URL from the point of view of an inexperienced user, with clearer instructions and a straightforward software tool. However, none of the case study teams found PrOACT-URL particularly difficult to implement.
The use of a descriptive framework is not essential but is highly recommended, even for users with little prior experience of benefit-risk assessment. Benefit-risk decisions can be extremely complex, and the use of a framework can help to ensure that key aspects of the process are neither overlooked nor handled inappropriately.
Furthermore, and of particular relevance to the goals of PROTECT, frameworks enhance the transparency of the process and facilitate communication of the results. A structured stepwise analysis of the problem provides a clear audit trail to enable others to understand the reasoning behind a set of findings. By documenting the interpretation of the available evidence, it allows traceability for reviews and related future assessments of the same medicinal product.
-
What are our recommendations regarding the use of visualisations at the Planning stage?
What are our recommendations regarding the use of visualisations at the Planning stage?
When structuring a decision problem at the Planning stage, it is recommended to visually map all benefits and risks that are being considered for the analysis in a hierarchical diagram, called a value tree or attribute tree. This diagram lists and clusters the key benefits and risks that were initially identified. Those measures with particular relevance to the decision maker are focused on in the analysis and should be highlighted within the value tree in order to enhance transparency and the communication of the process, assumptions, and its results.
Various software tools are available to produce a tree diagram, including Microsoft Excel, Microsoft Word SmartArt Graphics, the BRAT Tool, and FreeMind Software, and are also typically included in MCDA software.
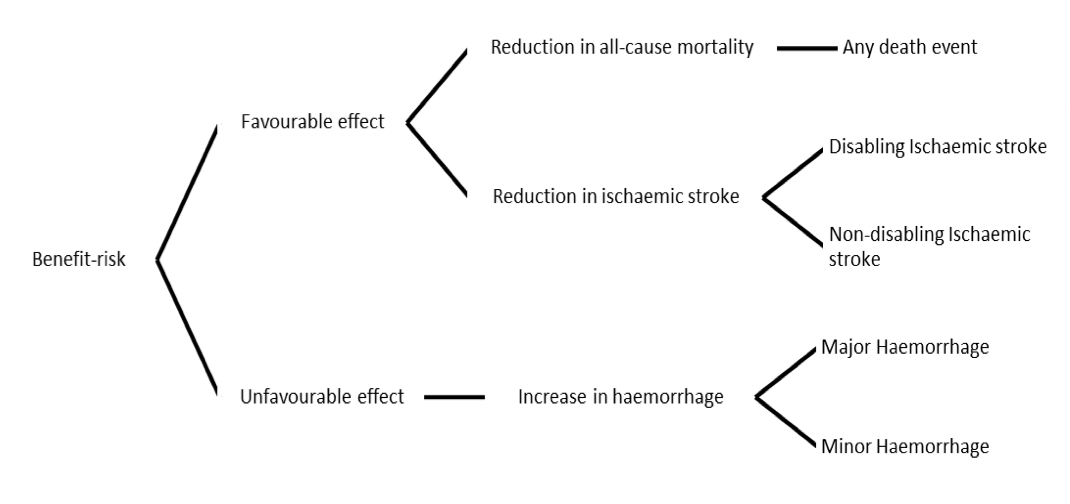
An example of a value tree from the Wave 2 warfarin case study is shown below (Figure 1), and additional samples are available in the other case study report. First, the benefit and risk categories (e.g., clusters of benefits and risks) are identified, and then specific outcomes within these categories can be determined.
Figure 1 Value tree for the Wave 2 warfarin case study
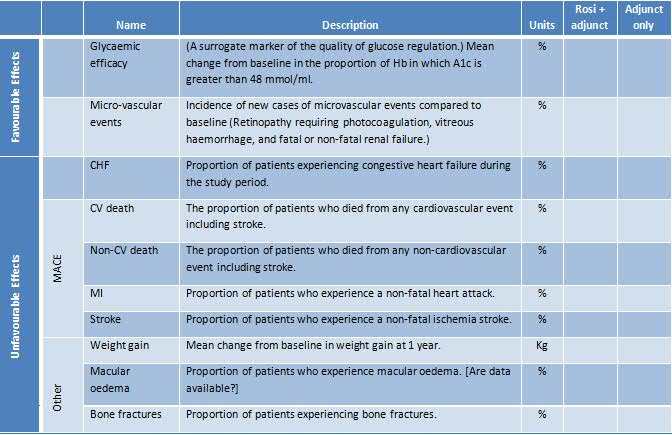
We also recommend that a table template (either "effects table" or "source data table") is prepared in order to represent the data that are required to be collected. An example from the Wave 2 rosiglitazone case study is shown in Table 3. At the Planning Stage, only the structure of the table is created, which constitutes the names and descriptions of all effects, the units characterising the measures of the effects, and the names of the criteria. The data will be filled in later. Again, the effects have been first named loosely (shown here as "Name") and then more precisely ("Description"). This table goes a step further by defining the precise measures and their units.
Table 3 Structure for an Effects Table based on the Wave 2 rosiglitazone case study
The effects table and value tree are two different ways of visualising the set of benefit and risk criteria that will be included in the benefit-risk analysis model. The value tree in particular has been used frequently within benefit-risk analyses, and the term "value tree" is often used to refer to the criteria themselves when taken as a whole, not just the visualisation. We adopt this usage for the next section, which discusses the practical aspects of identifying the important benefit and risk criteria.
-
How were value trees constructed for the case studies and what lessons were learned?
How were value trees constructed for the case studies and what lessons were learned?
All case studies used a sequential approach for building a value tree, starting by creating an initial value tree that displayed all the benefit and risk outcomes of potential relevance to the decision problem. Building on the initial value tree, teams created an additional version of this visual to form the basis of the quantitative analysis. This process is often called "pruning" and involves excluding the less relevant benefit and risk outcomes to achieve requisite size for a more efficient and insightful analysis. Documenting why benefits or risks were excluded from or included in the equation is key at this later "pruning" stage.
Different sources of information were chosen in the case studies on how to identify those benefits and risks that form the basis of the initial value tree, including examination of regulatory documents (the Wave 1 efalizumab case study), searching the clinical literature for relevant trials (the Wave 1 natalizumab case study), or a face-to-face brainstorming session (the Wave 2 warfarin case study).
The time horizon for measuring the occurrence of benefits and risks was usually determined by the length of the clinical studies from which data were drawn, or by the length of follow-up time within which the main risks were identified. In the Wave 1 efalizumab case study, benefit was measured over a 12-week study period whilst the risk of PML occurrence within a 3-year time horizon was taken into account.
Importantly, the time horizon for the expected impact of benefits and risks will often extend far beyond the time period within which the occurrence of the initial events was identified. In summary, a mixture of timeframes can be used in any analysis, provided that there is no double counting. However, there is no requirement that all criteria should work to the same time horizon provided that the time horizon is specified for each effect. Thus, short-term benefits could be balanced against long-term side effects.
It was also noted that some attributes (e.g., blood pressure reduction) could in one context be defined as a risk and in another more appropriately as a benefit, depending on the health state of the patients receiving the medication. In most value trees, this can be addressed using clear labelling and should not impact the analysis results.
Identification of key benefits and risks within the value tree is an example of how findings from the Evidence Gathering and Data Preparation stage (extraction of clinical data) often feed back to the Planning stage of the benefit-risk assessment. Hereby, documenting data that could not be found not only provides critical transparency on the process but is also considered an important way of identifying the need for further studies.
Depending on the type of analysis that is considered possible, it may not be feasible to include particular outcomes within a specific methodology. For example, the Wave 1 rimonabant case study subteam investigating population impact numbers were unable to include the continuous endpoints that were used elsewhere in the case study as impact numbers can only be defined for binary endpoints.
On this issue of feasibility, it is critical to document the appropriateness of a chosen analysis methodology and to ensure the best methodology is chosen in light of all available evidence.
As a general principle, any effects for which a reasonable amount of evidence is available and which could also impact the benefit-risk balance should be included in the analysis. If there is substantial uncertainty on an effect's size, a sensitivity analysis should be performed to examine the potential level of impact on the overall benefit-risk profile of a medicine. Directly assessed preference values may be useful to assess the potential weight of an effect.
Once all relevant benefits and risks have been listed, a critical step is, for each of these, to identify and document which measurements from which data source will be used to form the basis for the quantitative analysis. (Refer to the Analysis stage for additional details and to the Wave 2 warfarin case study report Appendix 3 for a description of the iterative process.)
The validity of the analysis results depends on successfully applying to the value tree, and specifically to the measurements, the following criteria[ More detail is given in Section 5.4.4 of Dodgson, et al. (2000).]:
-
1.Completeness: All criteria that could affect the overall result are included.
- 2.Avoidance of double-counting: If two outcomes are overlapping, or if one acts as a surrogate for another, only one should be included. Although it may not always be possible to fully eliminate double counting (for an example, see Section 5.3 of the Wave 2 warfarin case study), it should always be minimised as far as possible.
- The Wave 1 natalizumab case study acknowledged that "double counting must be avoided" but also noted that "there was a general concern that the value tree will provide visual imbalance that may transfer into numerical differences later if the group is too selective on either benefits or risks."
- Criteria that are very similar can be redefined as one criterion or investigated singly at the Exploration stage (e.g., the physician's global assessment of psoriasis and the patient's global assessment may be based on identical criteria; in which case, each should be considered singly in two separate analyses). A patient's response should be counted only once for a given effect; this is frequently violated in the benefit-risk assessment of drugs (e.g., the percentage of patients surviving to 24 months always also includes those surviving to 18 months and 12 months; the criteria should be redefined, e.g., as patients surviving up to 12 months, 12 months to 23 months, and 24 months or beyond).
- 3.Preference Independence: The preference order of options on any one effect is unaffected by the preference order on any other effect. This condition is weaker than statistical independence; scores on criteria can be statistically correlated but preference independent. For example, assessors might judge that their preferences for options on a primary endpoint would be the same however the options score on a secondary endpoint, thus establishing that the primary endpoint preferences are preference independent of preferences on the secondary endpoint. However, they might also argue that if performance of an option on a primary endpoint is poor, then they might assign a higher preference for an option on a secondary endpoint; thus, the preferences on the secondary endpoint would not be preference independent of primary endpoint preferences, thus violating the condition of preference independence. This is a requirement if weighted scores are to be interpreted unambiguously for any model approach in which weighted averages are taken.
A key learning from the case studies is to ensure that sufficient time is allocated for constructing a value tree (and for the Planning stage in general). Several case study teams found this part of the process took longer than expected. In the case of the Wave 1 rimonabant case study, the team found it difficult in the time allocated to reach a consensus regarding which outcomes to include and which to exclude. This is particularly problematic because, if the problem is framed inappropriately at the Planning stage, it may lead to the need for additional revisions of the analysis later in the process and potentially invalidate the entire analysis.
A final recommendation emerged from looking back over the eight case studies listed in Table 1. All groups initially assumed that the benefits and risks listed in the important source documents were to be taken as given and could be used in the same benefit-risk analysis. However, each task group examined the available literature and found it helpful to engage several people to advise on the structure of the value tree and the data table.
