-
Exploration: Summary of Key Points
Exploration
Subsequent to the main analysis, the results need to be assessed for robustness and sensitivity to the various assumptions, divergent views, and sources of uncertainties. Decision makers have different attitudes to uncertainty, and the nature of the key uncertainties should be explained as clearly as possible to enable an informed decision to be made. Since many of the inputs in a benefit-risk assessment, such as clinical data values and preference weights, are subject to uncertainty, it is important to assess whether the strength of the conclusion is affected by these uncertainties.
It is also important to explore further the consequences of a decision, and consider whether the results of the benefit-risk assessment may inform related decisions on risk management plans (RMPs) or benefit-risk assessments of similar medicinal products.
Statistical and modelling expertise are key resources at the Exploration stage, though clinical knowledge is still important.
Summary of key points
- Subsequent to the main analysis, the strength of the conclusion needs to be assessed for robustness and sensitivity to the various assumptions and sources of uncertainties.
- Presenting an uncertainty analysis is central to ensuring proper interpretation of the results of decision models. It serves as a reminder that the "single number" output of quantitative models is dependent on multiple uncertain inputs.
- PROTECT WP5 recommends that the appropriate statistical, modelling, and clinical expertise is engaged at this stage.
- Relative to the exploration of the benefit-risk analysis, PROTECT WP5 recommends that bias, mismatched populations, sampling error, missing data, and disagreements amongst assessors, factors which contribute to uncertainty in the conclusions, are acknowledged and factored into the final conclusion of the benefit-risk assessment.
- It is recommended that decision makers explore how the uncertainties affect the benefit-risk balance by applying sensitivity analysis, such as repeating the analysis using the same model with different sets of input values. Other methods are Indirect/Mixed Treatment Comparison (ITC/MTC), Probabilistic Simulation Method (PSM), and Stochastic Multi-criteria Acceptability Analysis (SMAA).
- The following visual types were found to be useful in the Exploration stage: Box plot (box and whisker diagram), distribution plots, forest/interval plot, tornado diagram, scatter graph, and the interactive versions of these visualisations.
-
How does uncertainty arise in a benefit-risk assessment?
How does uncertainty arise in a benefit-risk assessment?
Published studies in the medical literature tend to report measures of uncertainty only using confidence intervals and p-values, which relate to sampling error only. There may be other sources of uncertainty that may affect the study results. Advanced statistical modelling may be able to account for some of these uncertainties but not for all. In any case, uncertainty should be addressed and not ignored.
Factors that can contribute to the uncertainty of results in a benefit-risk analysis include the following:
- Mismatched populations
- Sampling error
- the population in which the medicinal effects data or elicited preferences came from does not reflect the population for which the decision is to be made
- Within-population variability
- certain data, e.g., the average results in a study population, may not be generalisable to different subgroups of the target population
- Missing data (e.g., data were not collected or observed on a particular benefit or risk, lack of comparator data in long term extension clinical studies, poorly recorded data that cannot be used for analysis, inconsistent or varying definitions of clinical outcomes or endpoints)
- Unresolved disagreements amongst assessors (e.g., choice of criteria, criterion weights, appropriate comparators, data sources, preferences, and interpretation of results)
- Bias (systematic error in a model or process) can arise in many areas of a benefit-risk assessment, e.g.:
- In medicinal effects data (e.g., due to dropouts or treatment crossover in clinical trials, or selection bias or confounding in observational studies)
- in elicited preferences (e.g., due to poorly framed questions)
- between comparators due to the structure of the benefit-risk decision model (e.g., due to inappropriate assumptions, or key benefits and risks having been omitted)
Some sources of bias that contribute to uncertainty in a benefit-risk assessment could be minimised by designing the benefit-risk assessment carefully and using data from highly relevant and validated sources. However, one cannot guarantee that bias has been completely eliminated.
With access to sufficient patient-level data, more complex methods of analysis can be used to reduce the problems presented by mismatched populations and within-population variability. For example, the Wave 2 warfarin case study constructed a model to predict the benefit-risk balance for patients based on their individual characteristics.
-
How does uncertainty affect the analysis results?
How does uncertainty affect the analysis results?
Sensitivity analysis is a well-established technique for exploring the robustness of a model. It is widely employed in a number of fields.
Sensitivity analysis aims to uncover the extent to which changes in the inputs of a model affect the results. This is achieved by re-running the model using different input scenarios and observing the change in the results.
Although full sensitivity analysis involving multiple outcome effects is possible and encouraged, in practice it is likely to be limited to a small number of scenarios. This is because the amount of information to be presented would otherwise be overwhelming. It is with quantitative benefit-risk models that uncertainty analysis really shows its value, as it is not necessary to present every simulated scenario but simply summary statistics that convey the variability of the benefit-risk balance. This allows systematic evaluation and presentation of a more comprehensive range of possibilities. An example of this approach is the probabilistic simulation method (PSM), which is aimed at revealing the entire distribution of possible values of the benefit-risk balance.
Presenting an uncertainty analysis is central to ensuring proper interpretation of the results of decision models. It serves as a reminder that the "single number" output of quantitative models is dependent on multiple uncertain inputs and encourages decision makers to consider whether that uncertainty is enough to cast doubt on the results and how it affects the decision.
-
How does uncertainty affect the decision that needs to be made?
How does uncertainty affect the decision that needs to be made?
Attitudes to uncertainty may vary amongst stakeholders. What this means is that the impact of uncertainty on a benefit-risk assessment depends not only on the extent of the uncertainty but also on the perspective that is adopted.
Attitudes to uncertainty vary between individuals for reasons that may not always be tangible. For example, it has been observed that assessors tend to become more risk-averse as they become more experienced; and that female assessors are more willing to take risks than males (Beyer et al., 2013). Attitude to uncertainty is therefore one of the main reasons for disagreement within groups, and this can be a barrier to transparent decision making. Exploration of uncertainty cannot necessarily resolve all such problems, but it can help to ensure that the nature of any uncertainty is better understood so that the issues can be tackled in a logical way.
Attitudes to uncertainty in benefit-risk assessment are also subject to external influences. For instance, major safety concerns about any individual drug may lead to a more cautious regulatory climate and thereby impact upon the assessment of seemingly unrelated treatments. A stark example of this is the thalidomide scandal, which led to significant changes in regulatory requirements for medicines, such as the introduction of the Kefauver-Harris Drug Amendment Act in the USA. The attitude of patients and the public may also have an effect, e.g., pressure from patient groups resulted in a licensing change for the use of natalizumab for multiple sclerosis in the EU.
-
What related decisions might also be affected by a benefit-risk assessment?
What related decisions might also be affected by a benefit-risk assessment?
The benefit-risk methodologies reviewed by PROTECT WP5 are aimed at increasing the transparency of benefit-risk decision making. One of many advantages of increased transparency is that it can help to ensure that related decisions are made on a consistent basis.
Benefit-risk assessments can be considered to be related if they share one or more elements; e.g., two assessments may have treatments, benefits and risks, target populations, data sources, or methodological approaches in common. A decision maker who visits any particular concept in more than one benefit-risk assessment should consider the consistency of the approaches that were chosen in each instance and be prepared to justify any differences on the basis of the decision context.
For instance, both the Wave 1 efalizumab case study and the Wave 1 natalizumab case study shared the key risk criterion of progressive multifocal leucoencephalopathy (PML), and both case studies considered the regulatory question of whether the treatment should be given marketing authorisation. The weight given to PML in each of their MCDA decision models was significantly higher for natalizumab (55.9%) than efalizumab (12.8%), which might suggest inconsistency. However, caution should be exercised in comparing weights or weighted preference values between different methods or models. The reason is that no modelling approach, with the exception of QALYs or DALYs, uses a unit of utility that stays constant across different models; the scales are defined locally for a given model, not globally across all models. In addition, the number of criteria and scale ranges can affect the values of normalised weights.
What could be compared across two separate MCDA models are ratios of weights for criteria held in common between the models. For efalizumab and natalizumab, only PML is held in common; there is not a second identical criterion. However, potentially life-threatening outcomes, for different reasons, are common to both drugs: transaminases elevation (which could indicate liver damage) in natalizumab and serious infections (requiring hospitalisation) in efalizumab. The ratio of PML to transaminases elevation is 55.9 ?· 11.2 = 4.99, and the ratio of PML to serious infections is 12.8 ?· 2.6 = 4.92. The near-identical ratios could be a coincidence but might also suggest a degree of consistency between the judgements of the two teams that modelled these drugs.
Another example relates to the merging of new drugs/competitors to the market, as in the Wave 2 warfarin case study. Initially, the benefit-risk balance of warfarin was deemed positive against no treatment. However, it is not equally clear that the benefit-risk balance of warfarin would have been deemed positive if the assessment were to be made today against newer drugs.
Benefit-risk assessments also play a part in certain key regulatory requirements for pharmaceutical products. For example, in the post-marketing setting, the International Conference on Harmonisation of Technical Requirements for Registration of Pharmaceuticals for Human Use (ICH) has recently published guidance recommending that the Marketing Authorisation Holder (MAH) should submit a Periodic Benefit-Risk Evaluation Report (PBRER) to the regulatory authorities.
Another key regulatory document is the Risk Management Plan (RMP), which identifies options to prevent, minimise, or mitigate the impact of risks related to the medicine. RMPs have a two-way relationship with the benefit-risk assessment: benefit-risk can help to identify and prioritise the key risks to be managed, and the RMP, particularly the assessment of the effectiveness of risk minimisation, can help to refine estimates of the impact of those risks in future assessments.
Benefit-risk assessments may also influence the information that is recorded on Company Core Data Sheets (CCDS) for pharmacovigilance purposes.
-
Which of the methodologies tested can help with the Exploration stage?
Which of the methodologies tested can help with the Exploration stage?
It may not be necessary to employ additional methodologies for exploration purposes. The Exploration stage may simply involve revisiting earlier stages of the assessment and performing sensitivity testing using the same model with different scenarios. Alternatively, the effect of using different methodologies could be deliberately explored. The PROTECT WP5 cases were chosen because of their complexity which invoked the application of the more quantitative methodologies.
A few of the methodologies discussed in the previous sections have features that facilitate exploration in that they can help to quantify uncertainty:
- Indirect/Mixed Treatment Comparison (ITC/MTC)
- Utility survey techniques
- Probabilistic simulation method (PSM)
- Stochastic Multi-criteria Acceptability Analysis (SMAA)
-
What are our recommendations regarding the use of specific methodologies at the Exploration stage?
What are our recommendations regarding the use of specific methodologies at the Exploration stage?
Indirect/Mixed Treatment Comparison (ITC/MTC)
ITC/MTC provides a principled framework for propagating source data through Bayesian data networks that may be required for comparative benefit-risk assessments. The method offers increased transparency in terms of clarifying the sources of evidence used and the extent to which uncertainties in the source data translate to uncertainty in the benefit-risk assessment metrics. The statistical uncertainty associated with using indirect evidence is greater than when direct evidence is used, and ITC/MTC makes allowance for this.
The method's ability to compare treatment options allows a wider range of comparators to be considered, which may be another aspect of the analysis to be explored at this stage.
The section on Evidence Gathering and Data Preparation includes further discussion of ITC/MTC.
The Wave 2 rimonabant case study used a Discrete Choice Experiment (DCE) to elicit preferences from the public. Analysis of the DCE provided estimates of the variability of the preference weights. This approach could be used in tandem with a quantitative benefit-risk assessment in order to explore the uncertainty related to preference weights and has the advantage that the range of weights explored is based on experimental evidence (compared to the standard SMAA approach whereby all possible combinations of weights are explored). It may also be possible to quantify the uncertainty of value preferences using other utility survey techniques, such as the Analytic Hierarchy Process (AHP).
Further discussion of the utility survey techniques can be found in the Analysis section.
Probabilistic Simulation Method (PSM)
PSM can be used in conjunction with other quantitative benefit-risk models to explore the impact of uncertainty in input data on the final benefit-risk balance. It can be based either on theoretical distributions for the uncertain input parameters (Monte Carlo simulation) or a re-sampling from individual patient data (if such data are available).
PSM has two important advantages compared to a standard sensitivity analysis: The use of individual patient data or appropriate probability distributions can ensure that the scenarios explored are realistic; and it also provides a more complete picture of the variability of the results. In summary, it is a sound method from a statistical point of view. The danger is that it can lead to overconfidence in the results, in particular because it is unlikely that all sources of uncertainty can be accounted for in PSM. In other words, the fact that one source of variability has been thoroughly explored using PSM does not mean that any other source of uncertainty can be ignored. The probabilistic assumptions underlying applications of PSM should always be considered. For example, all applications in the PROTECT WP5 case studies assumed that the probabilities of benefits and risks were uncorrelated with one another. Such assumptions may not always be realistic.
Stochastic Multi-criteria Acceptability Analysis (SMAA)
SMAA is an implementation of PSM within an MCDA framework, allowing for uncertainty of treatment effects data and preferences. The general comments above regarding PSM, therefore, also apply to SMAA. A particular strength of SMAA is its ability to explore preference uncertainty with very little prior information, which may be a more straightforward approach than attempting to characterise preferences using a probability distribution.
-
What are our recommendations regarding the use of visualisations at the Exploration stage?
What are our recommendations regarding the use of visualisations at the Exploration stage?
The visualisations discussed below all have features that may be helpful when exploring and communicating the uncertainty of the benefit-risk balance.
Box plot
ITC/MTC provides a principled framework for propagating source data through Bayesian data networks that may be required for comparative benefit-risk assessments. The method offers increased transparency in terms of clarifying the sources of evidence used and the extent to which uncertainties in the source data translate to uncertainty in the benefit-risk assessment metrics. The statistical uncertainty associated with using indirect evidence is greater than when direct evidence is used, and ITC/MTC makes allowance for this.
The method's ability to compare treatment options allows a wider range of comparators to be considered, which may be another aspect of the analysis to be explored at this stage.
The section on Evidence Gathering and Data Preparation includes further discussion of ITC/MTC.
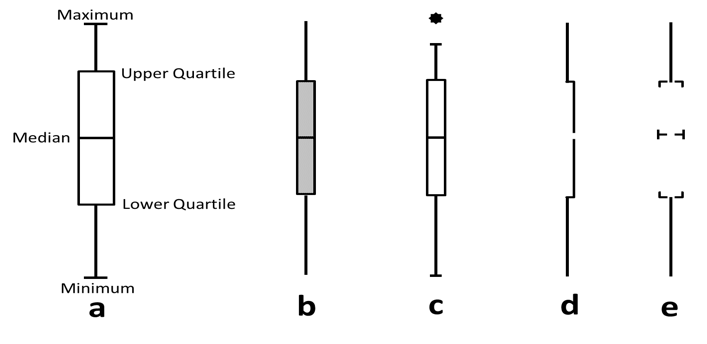
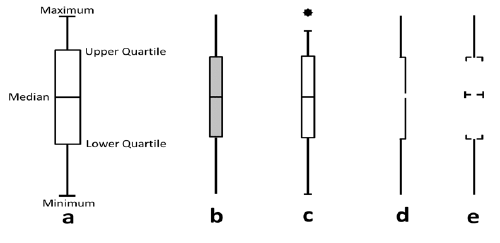
Box plots (also known as box and whisker diagrams, or by further variants thereof) are used to convey statistical information about the range of values taken by a variable. Box plots come in many varieties (see Figure 20), but the basic principle in the same: the lengths of the different segments of the plot provide information about the spread of values and reflect the bias or skewness in the data. Outliers are sometimes presented as points away from the main box plot. Due to the technical constructions of box plots, their use may be limited to experts or trained audiences who have some understanding of statistical summary measures (e.g., medians, means, quartiles, outliers); without this, there is a danger that the segments will be interpreted as having some other (perhaps clinical) meaning.
Figure 20 The anatomy and variations of box plots (reproduced from Potter K. Methods for presenting statistical information: the box plot. 2006.)
Distribution plot
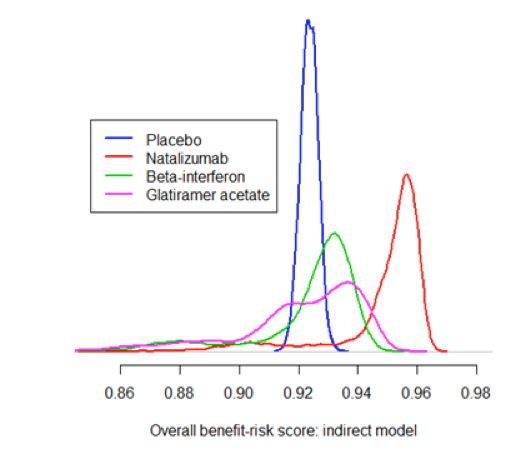
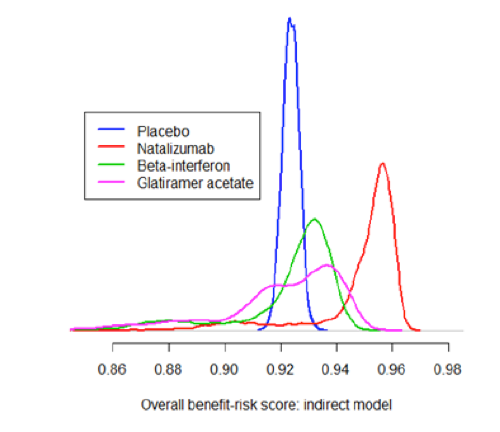
Distribution plots are the only widely used graphics that display the shape of an entire probability distribution. As such, they contain more information than simpler graphics like box plots or interval plots. For this reason, distribution plots must be based on large datasets; typical uses include showing the range of values of a measurement taken in a large group of patients or summarising the thousands of iterations produced by probabilistic simulation models.
Although these diagrams may be appealing to specialist audiences, they may be less helpful for those without the necessary technical background.
Distribution plots can be useful when making comparisons between treatments or groups as they convey a sense of statistical significance. However, box plots and interval plots also share this property to some extent and are arguably simpler to generate and communicate to a wider range of audiences.
Figure 21 Distribution plot showing the distribution of the benefit-risk score for four treatments: from the Wave 2 natalizumab case study
Forest/interval plot
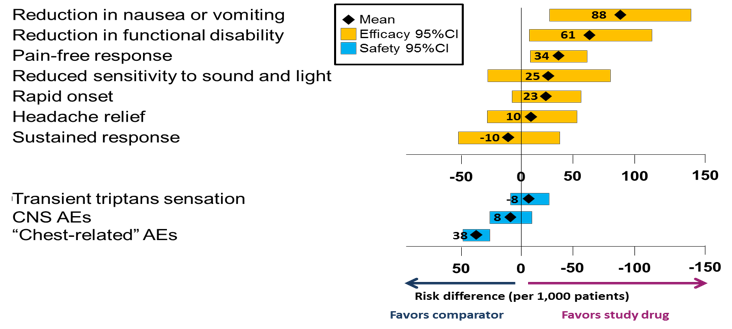
Forest/interval plots provide a sense of the distribution of a range of values without all the detail of distribution plots. By convention, forest/interval plots show means and 95% confidence limits, which are arguably more relevant to medical decision making than the measures of spread shown by a box plot. Other measures could be used if desired.
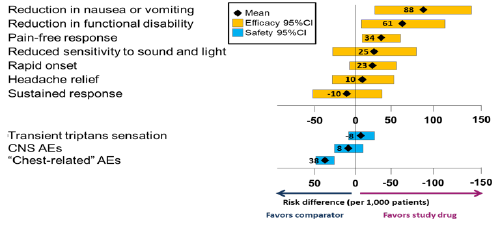
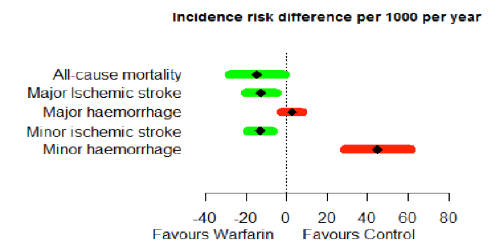
Forest/interval plots are recommended in situations where it is important to visualise the mean effect sizes and confidence intervals of two or more criteria alongside one another. One example is where benefits and risks are not integrated but simply presented side by side, as in Figure 22, which shows a confidence interval for each benefit and risk, aligned according to which treatment is favoured and with the neutral line of "no effect" clearly marked. However, this plot can only be produced if all the benefits and risks are expressed on the same scale (in this case, the risk difference between two treatments).
Figure 22 Forest plot showing the difference in risk per 1000 patients in using a constructed triptan vs. another constructed triptan for treating acute migraine (reproduced from Levitan et al., 2011)
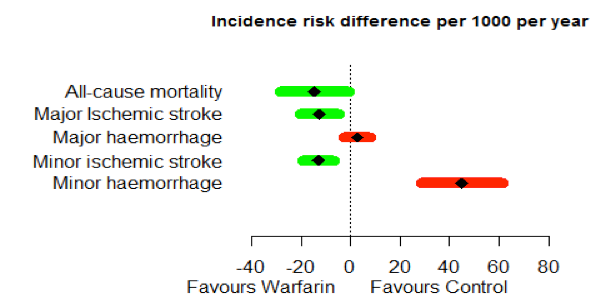
One possible drawback of this kind of forest plot was noted by the Wave 1 telithromycin case study team: "Wide variability, i.e., a long bar in the forest plot, can tend to overemphasise a less important variable if the data are not weighted." Furthermore, presenting the benefits and risks alongside each other on the same scale could be taken to imply equal weighting. The Wave 2 warfarin case study addressed this issue to some extent by ordering the benefits and risks according to elicited preference weights (Figure 23); the Wave 1 natalizumab case study team suggested taking this a step further by incorporating the weights in the labels.
Figure 23 Forest plot illustration of the difference in consequence using risk difference per 1000 patients per year for the Wave 2 warfarin case study. The criteria are listed in order of importance (highest rank at the top)
Tornado diagram
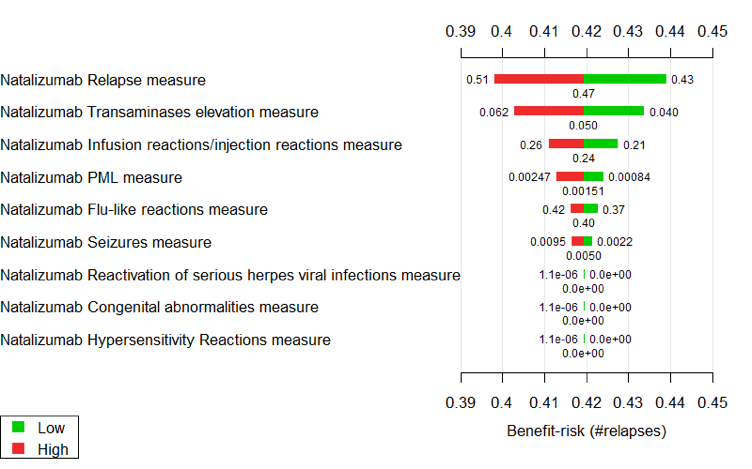
A tornado diagram is a specialised bar chart that is designed to show the results of a sensitivity analysis. An example from the Wave 1 natalizumab case study is shown in Figure 24. For each benefit or risk, the width of the red and green bars shows the effect on the overall benefit-risk score if the treatment effect is changed from the central estimate (shown under the bars) to a higher or lower value (shown beside the bars).
Figure 24 Tornado diagram illustrating sensitivity of the benefit-risk score to change in treatment effects data in the Wave 1 natalizumab case study
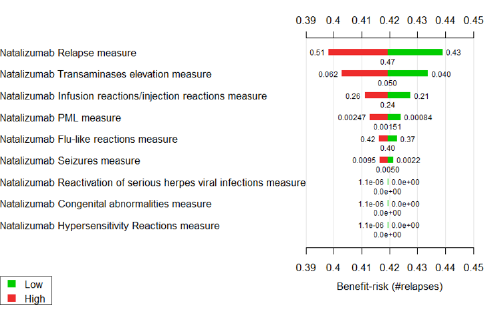
Interpretation of tornado diagrams can be confusing. Audiences who are unfamiliar with the technical details can easily misunderstand their purpose and intended message. Even with the right technical knowledge, it is difficult to gain a sense of the overall uncertainty of the benefit-risk balance based on the information provided in Figure 24. However, the diagram does effectively convey which criteria are most fundamental to the benefit-risk balance.
Scatter graph
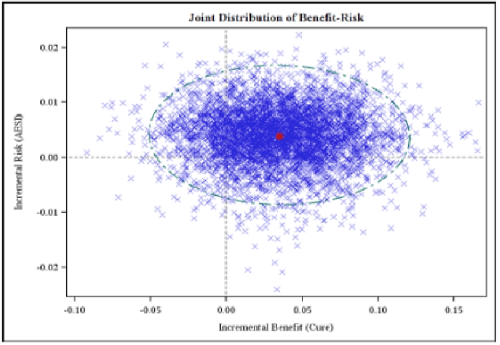
Scatter graphs are simple depictions of multiple points in two dimensions. Like distribution plots, they are generated from large datasets, but each point encodes two variables instead of just one. This makes scatter graphs useful for examining the relationship between variables. For example, Figure 25 compares two outputs of multiple simulation runs in the Wave 1 telithromycin case study.
Figure 25 Scatter plot of incremental harm versus incremental benefit from PROTECT WP5 Wave 1 telithromycin case study
Interactive visualisations
Interactive visualisations on a computer screen provide a user with the ability to change key parameters and observe the effect on the output of a benefit-risk model. These visualisations, although technically demanding and therefore not widely used, have great potential as part of the Exploration process. Interactive visuals enable active participation of the audience, which can increase attention and perception. Through interactive visualisations, it is possible to personalise the information communicated, by allowing the audience to investigate various aspects of a problem that they consider important (to personal decision making) or to explore areas which are still unclear in the primary visuals.
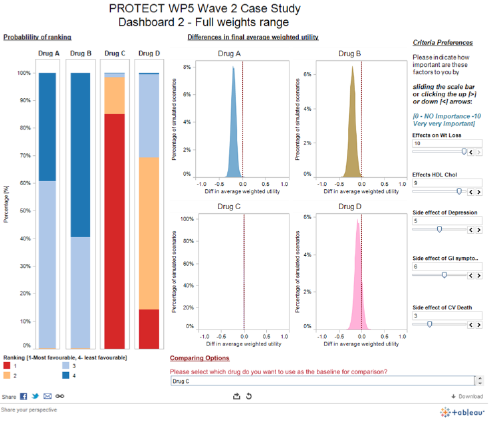
It is recommended that related interactive visualisations required to make a decision should be presented on a dashboard. A dashboard is a visual display of the most important information needed to achieve one or more objectives, consolidated and arranged on a single screen so the information can be monitored at a glance (Few, 2004).
The Wave 2 rimonabant case study team developed several interactive dashboards: a screenshot from one is shown below (Figure 26), and the full dashboard can be found online.
Figure 26 Interactive SMAA-based dashboard from the Wave 2 rimonabant case study
The Stage 2 Visual Review (Mt-Isa et al., 2013b) contains some guidelines and further references on the creation of interactive dashboards.