-
Analysis: Summary of Key Points
Analysis
At the Analysis stage, the data are evaluated to quantify the magnitudes of benefits and risks for the drugs of interest. Depending on the purpose and context of the benefit-risk assessment, the benefits and risks may be weighted and integrated to provide a quantitative measure of the benefit-risk balance.
Summary of key points
- A full populated data table or a forest plot, if the plot can accommodate all of the benefits and risks, should be the starting point for a benefit-risk analysis
- The type of analysis is determined by the scope and complexity of the data, as well as the decision maker’s judgement regarding the weight of evidence in the data table. Specifically, the decision maker should consider whether a qualitative analysis based on inspection of the data table is sufficient to enable a justifiable benefit-risk decision, or whether quantitative methodologies would strengthen the decision by providing a transparent, integrated measure of the benefit-risk balance.
- Data are analysed to quantify the magnitudes of benefits and risks for the drugs of interest. Depending on the purpose and context of the benefit-risk assessment, the benefits and risks in addition may be weighted and combined to provide a single integrated measure of the benefit-risk balance.
- Weighting is an exercise in which a judgement is made regarding the relative importance of the criteria in the data table.
- Implicit weighting (i.e., where the decision maker does not have to quantify the difference in importance of specific benefits and risks) is adequate for simple cases where the following conditions are satisfied: (1) Only a small number of benefit and risk criteria (or sets of criteria) are to be weighed against each other; (2) Only a small number of comparators are involved; and (3) The difference in importance between the criteria being traded off is intuitively clear. However, if any of these three conditions are not met, the cognitive strain involved in implicit weighting becomes overwhelming.
- When implicit weighting is inadequate, quantitative modelling preference between options can facilitate an integrative approach and assist decision making.
- Even if a qualitative analysis is sufficient, there are reasons why a decision maker might wish to incorporate preference weights and express the benefit-risk balance in quantitative terms. Explicit weighting can increase the transparency of the decision process, help to ensure consistency with other decisions, and establish priorities for the development of new treatments. Expressing the benefit-risk balance numerically can better facilitate the sensitivity analysis, helping to ensure that decisions are robust.
- Quantitative methods require technical expertise and are generally more demanding in terms of resources than qualitative methods.
- When deciding whether to use quantitative methods and models, decision makers must consider the intended audience for the assessment and to whom it will be communicated, and adjust the outputs from the assessment to meet the needs of the audience.
- Three types of methodologies were evaluated for their usefulness during the Analysis stage:
- Metric Indices
- Quantitative Frameworks
- Utility Survey Techniques
- Though commonly known and used for benefit-risk assessment decision making, especially by clinicians, the metric indices were generally found to be inadequate for the purposes of benefit-risk assessment.
- Some complex problems, e.g., involving weighted criteria to be appraised for several alternatives, were addressed by using decision making tools derived from so-called Multi-Criteria Analysis (MCA) methods. One of these, MCDA, extensively described by Keeney and Raiffa (1976), was tested in all Wave 1 and most of the Wave 2 case studies, and was found to be efficient for this purpose. SMAA was also tested in some case studies with positive results.
- Of the four Utility Survey Techniques identified by PROTECT WP5, Discrete Choice Experiments (DCE) was recommended to be applied in the PROTECT WP5 case studies.
- PROTECT WP5 recommends holding a decision conference (i.e., a meeting amongst the individuals representing key stakeholder views) to discuss and arrive at consensus judgements of the importance of the benefit and risk criteria, and to organise the process of eliciting preference values for a benefit-risk analysis.
- It is recommended that the set of stakeholders selected for the decision conferences is wide enough to accommodate the views of the different parties (e.g., regulators, physicians, patients).
- Because they can inform which criteria to include, as well as their relative importance, where practical, it is recommended that the perspectives of patients be included in the benefit-risk assessment.
- The use of appropriate visualisations can expedite stakeholders’ response times when reading outputs from a benefit-risk analysis. Therefore, it is recommended that graphics be well designed for the intended audience (i.e., additional work may be required to design effective graphics for communicating benefit-risk information to an audience with perceived low numeracy skills (Dolan et al., 2012)).
- A table or forest/interval plot should be used to present the results of a qualitative or partially quantitative analysis. In particular, tables provide fast and efficient readability across issues displayed in rows and columns. Tables can:
- serve as a common means for benefit-risk communications because of their simple structure, flexibility, and the ease with which they can be adapted
- be very powerful as a communication tool whilst conveying a substantial amount of information
- be used when communicating benefits and risks to all audiences, including the general public, mass media, patients, physicians, regulators, and other experts such as analysts
- ease cognitive burden of the users and decrease the time required to extract the information
- be limited to the requisite number of rows and columns to avoid adding cognitive burden when reading tables
- have their readability enhanced through the use of colour-coding to represent grouping and relationships
- The use of a value tree is recommended to communicate the structure of the decision problem to the stakeholders for all elicitation methodologies.
- For preference elicitation, the use of visualisation methods can reduce cognitive burden on the stakeholders, ensure proper understanding of the message, and engage stakeholders in the elicitation process.
- It is recommended to use a bar chart to present the results of an integrative benefit-risk assessment.
- Bar charts (e.g., simple, stacked, grouped) can be used to communicate the magnitude of any measure (e.g., benefit-risk score, probability of outperforming a comparator), and stacked bar charts can be used to depict different parts or components (proportions).
- Bar charts can be used to display the benefit-risk trade-offs and to compare between options.
- Bar charts (e.g., the Hiview3 difference display) can be used to indicate the difference in benefit and risk scores between two treatments.
- This is a particularly important visualisation because of the comparative nature of the benefit-risk assessment.
- The difference display has been found to be a very useful visualisation of benefit-risk balance in regulatory decision making (European Medicines Agency, 2012).
- Bar charts may be a useful visual communication tool for a large variety of audiences, such as the general public through the media, patients, physicians, regulators, and other experts because of the simplicity in their design concept.
- It is recommended that simple or stacked bar charts are used to visualise stakeholders’ value preferences (i.e., the weights of the benefit and risk criteria) and the magnitude of the final benefit-risk metrics when a quantitative benefit-risk assessment approach is used.
- The importance of presenting the preference weights should not be overlooked as this information is key to interpreting an integrated benefit-risk metric.
- It is recommended that stacked bar charts, difference displays, or grouped bar charts are used to visualise the contributions of the different benefit and risk criteria in the benefit-risk analysis.
- The use of an interactive table display is recommended in the application of MACBETH to ensure the categorical judgements from stakeholders are consistent across the different criteria.
- The use of an interactive thermometer scale may be useful to visualise the elicited preference values, allowing users to fine-tune the preference values within their consistency bounds.
- For weight elicitation, thermometer-like vertical sliders may be used; and interactive sliders may allow direct comparison and weighting of benefit and risk difference criteria on a pre-determined scale.
What type of analysis is required?
What type of analysis is required?
The starting point for analysis is a fully populated data table (or a forest plot if it can accommodate all of the benefits and risks).
"Fully populated" does not mean that every item of clinical evidence is known with certainty. As highlighted in the Evidence Gathering and Data Preparation section, there will always be uncertainty associated with the clinical evidence in the data table, and assumptions or provisional estimates may have been used in place of hard data. The sensitivity of the analysis to these uncertainties will be examined at the Exploration stage; but for the purpose of this Analysis section, we assume that the figures in the data table can be taken at face value.
The level of analysis that is required will depend on the decision maker's judgement regarding the weight of evidence in the data table. Specifically, the decision maker should consider whether a qualitative analysis based on inspection of the data table is sufficient to enable a justifiable benefit-risk decision, or whether a quantitative analysis would strengthen the decision by providing a transparent, integrated measure of the benefit-risk balance.
To illustrate this point, three scenarios involving hypothetical anti-obesity drugs are shown below in order of increasing complexity. To keep things simple, we have not given precise definitions of the benefit and risk measures, which are not of particular importance to the discussion.
Scenario A - a dominant drug
In the data table below, the percentages in the table represent the proportion of patients who experience each benefit or risk outcome.
Benefits Drug 1 Drug 2 Reduction in cholesterol 50% 40% Weight loss 20% 18% Risks Transient nausea 15% 20% Gastric ulcer 5% 6% Drug 1 is an example of a dominant alternative - it outperforms Drug 2 with respect to all of the benefit and risk criteria (i.e., it provides the greatest benefits and the smallest risks). On the basis of this evidence, any sensible decision maker would favour Drug 1. This is clear from a qualitative analysis of the data table, and further quantification to support the decision is not required.
Scenario B - a simple weighting problem
Drug 3 is a new drug that has been developed for the same indication. Replacing Drug 2 with the new treatment results in the following data table:
Benefits Drug 1 Drug 3 Reduction in cholesterol 50% 60% Weight loss 20% 20% Risks Transient nausea 15% 18% Gastric ulcer 5% 5% In this example, neither treatment dominates. Drug 3 achieves a greater cholesterol reduction than Drug 1 but causes slightly more transient nausea. If the decision maker judges that the reduction in cholesterol benefit outweighs the nausea risk, Drug 3 would be favoured.
This is a simple example of weighting, whereby a judgement is made regarding the relative importance of the criteria in the data table. In this case, the weighting was implicit, i.e., the decision maker did not have to quantify the difference in importance between nausea and reduced cholesterol, but may be able to make a sound benefit-risk decision based on a qualitative analysis of the data table.
Implicit weighting is adequate for simple cases where the following conditions are satisfied:
- Only a small number of benefit and risk criteria (or sets of criteria) are to be weighed against each other;
- Only a small number of comparators are involved; and
- The difference in importance between the criteria being traded off is intuitively clear.
However, if any of these three conditions are not met, the cognitive strain involved in implicit weighting becomes overwhelming, as illustrated by the next scenario.
Scenario C - a complex weighting problem
Sometime later, new studies have been carried out on Drugs 1, 2, and 3, providing updated estimates of the benefit and risk outcomes in the data table. The benefit-risk assessment is repeated with the resulting new data values:
Benefits Drug 1 Drug 2 Drug 3 Reduction in cholesterol 45% 42% 51% Weight loss 21% 23% 19% Risks Transient nausea 17% 14% 21% Gastric ulcer 3% 5% 7% In this scenario, the decision maker's task is considerably more difficult. Each of the three drugs has its own strengths and weaknesses amongst several key criteria. Attempting to weigh up the options implicitly and in a principled, transparent fashion becomes more challenging: such an approach would essentially constitute an attempt to mentally calculate and integrate the attractiveness of the three drugs' performance in relation to each of the four benefit and risk criteria, together with the relative importance of those four criteria. Even if the decision maker feels comfortable making the decision in this way, explaining the basis of the decision to a third party may not be as feasible. In other words, there is no transparency.
It is in such situations that quantitative analysis methods can help. Quantitative decision models are an aid to the cognitive process of decision making. They disaggregate a complex problem like Scenario C into simpler components that are easier to understand and weigh up, and then may go on to use principled methods to integrate the components into a measure of the overall benefit-risk balance. This approach:
- facilitates clear thinking;
- provides a path to resolving disagreement regarding the benefit-risk balance (by pinpointing the aspects of the problem where those disagreements occur); and
- leaves a clear audit trail of the process.
Even if a qualitative analysis is sufficient, there are reasons why a decision maker might wish to incorporate preference weights and express the benefit-risk balance in quantitative terms. Explicit weighting can increase the transparency of the decision process, help to ensure consistency with other decisions, and establish priorities for the development of new treatments. Expressing the benefit-risk balance numerically can facilitate the sensitivity analysis, helping to ensure that decisions are robust.
On the other hand, quantitative methods require technical expertise and are generally more demanding in terms of resources than qualitative methods. Quantitative analysis of simple benefit-risk decisions may not be appropriate, and each case will usually need to be judged on its own merits.
There may be a tendency amongst some decision makers to distrust quantitative models on the grounds that they reduce multi-faceted problems to a single number representing the benefit-risk balance, thus giving a false impression of simplicity and discarding important nuances, as well as negating the impact of expert clinical judgement. However, this is a misunderstanding regarding the nature and interpretation of such models. Although the output may be a single number, it should never be interpreted as an estimate of a universal truth; rather, it must be interpreted in light of the preference values used or elicited by the model.
It is in the preference values that the complex nuances of the problem are represented. However, this may be a difficult point to communicate to audiences not familiar with the methods and the assumptions, and so there remains a danger that the output of quantitative models may be misinterpreted. Decision makers should therefore think carefully about when to use quantitative modelling and to whom the benefit-risk analysis will be communicated and, if it seems likely that quantitative measures will be misinterpreted, consider presenting only a qualitative analysis or additional clarification of the quantitative results. Given the ongoing efforts in data transparency, it must be assumed that benefit-risk modelling results will be published if consequences, such as approval or rejection of a marketing authorisation, are based on it.
What types of methodologies are available to help with the Analysis stage?
What types of methodologies are available to help with the Analysis stage?
PROTECT WP5 identified three types of methodologies as being useful during the Analysis stage:
- Metric indices provide numerical representations of benefits and risks, and for some metric indices in which benefits and risks are traded off, such as QALYs, the trade-offs are implicit.
- Quantitative Frameworks facilitate the creation of customisable models for trading off of benefits and risks, and providing an integrated measure of the benefit-risk balance.
- Utility Survey Techniques are methods for eliciting stakeholder preference information, which can be used to integrate benefits and risks in quantitative decision models.
Which metric indices were identified and reviewed?
Which metric indices were identified and reviewed?
The metric indices can be classified into three sub-categories: those that provide indices that are used as thresholds, those that characterise health outcomes and implicitly trade off benefits and risks, and those that explicitly trade off the quantified benefits and risks but may not necessarily be specific to health outcomes. There are other basic metric indices commonly used in epidemiology such as the incidence rates, relative risks, odds ratios, and attributable risks. These are also suitable to quantify benefits and risks for the purpose of decision making in medicine, but have not been reviewed by PROTECT WP5 as a strong body of literature already exists to guide and evaluate their application.
Table 7 shows the metric indices identified by PROTECT WP5's Methodology Review (Mt-Isa et al., 2012).
Table 7 Metric indices
Threshold indices NNT / NNH AE-NNT / NEAR RV-NNH Impact numbers MCE RV-MCE MAR Health utility indices QALY / DALY / HALE Q-TWiST Trade-off indices UT-NNT INHB BRR GBR Principle of three TURBO BM Which metric indices were evaluated in the case studies?
Which metric indices were evaluated in the case studies?
Based on the appraisal execution results (as noted in Appendix 8), the following metric indices were recommended to be applied in the case studies:
- Number Needed to Treat (NNT) and Number Needed to Harm (NNH)
- Impact numbers
- Quality Adjusted Life Years (QALY)
- Quality adjusted Time Without Symptoms and Toxicity (Q-TWiST)
- Benefit-Risk Ratio (BRR)
NNT and NNH indicate the number of patients that would need to be given a treatment in order for a particular benefit (NNT) or risk (NNH) event to occur. Mathematically, they are calculated as the reciprocal of the difference between the event probabilities in the treated and untreated (or comparator) populations. The classical NNT/NNH approach to benefit-risk assessment allows only a single benefit and a single risk to be compared; and treatment is favoured if NNT>NNH. Implicitly, this gives equal weighting to the benefit and risk events. Extensions to NNT/NNH that allow weighting of multiple benefits and risks have also been developed.
Impact numbers are an extension of the NNT/NNH concept that indicates the numbers of people that will be affected by medical conditions and/or treatments in specific populations. As with NNT/NNH, if multiple benefits and risks are to be weighed against each other, then additional techniques must be adopted.
Quality Adjusted Life Years (QALYs) are a measure of a patient's remaining lifespan adjusted for quality of life within each health state within the lifespan. This is achieved by measuring the duration of time periods where quality of life is expected to be impaired and multiplying the duration with a measure of quality of life on a scale from zero to one. The quality of life judgements effectively require implicit weighting of benefits and risks. QALYs (and other related measures) are well-established in the treatment of chronic diseases, where their ability to account for the time spent in specific disease states is particularly important.
Q-TWiST is an extension of QALY specifically developed for application in cancer treatments based on discrete health states experienced by the patients. It was first proposed in breast cancer trials (Goldhirsch et al., 1989). Q-TWiST is obtained by dividing survival time into discrete health states: TOX (time subject to toxicity effect), TWiST (time without symptoms and toxicity), and REL (time of relapse to death).
Benefit-Risk Ratio (BRR) is based on the ratio of benefits to risks.
All of these metric indices except QALY and Q-TWiST were evaluated in the Wave 1 case studies, as shown in Table 8 below, as no suitable PROTECT WP5 case studies could be found due to data availability. This exemplifies the need to select the appropriate methodology relative to the benefit-risk assessment. The Wave 2 case studies did not use any of these specialised indices, but instead used more well-known epidemiological metrics (e.g., incidence) in combination with quantitative frameworks.
Table 8 Metric indices tested in the PROTECT WP5 case studies
Case study NNT/NNH Impact numbers QALY Q-TWiST BRR WAVE 1 Efalizumab 
Telithromycin Natalizumab Rimonabant WAVE 2 Efalizumab Telithromycin Natalizumab Rimonabant What are our recommendations regarding metric indices?
What are our recommendations regarding metric indices?
Number Needed to Treat / Number Needed to Harm (NNT/NNH)
NNT/NNH is characterised by its simplicity, which presents both advantages and disadvantages.
The concept has a simple interpretation and can be easily understood. Those who directly compare NNT and NNH for decision making purposes, however, should be aware of the implicit assumption they are making, i.e., that the benefit and risk events would be equally important. Furthermore, in its basic form, NNT/NNH has trouble dealing with more than one benefit and one risk, as noted in the Wave 1 rimonabant case study: "In analyses involving many criteria, the results from NNT are difficult to communicate and do not readily lend to a conclusion." We recognise that NNT or NNH is routinely used for communicating the likelihood of an individual event, particularly in physician-patient settings, and it may continue to be useful for this purpose. However, we cannot recommend NNT and NNH alone as useful measures for the purpose of weighing up multiple benefits and risks. Where benefits and risks of different relevance are included, "It does not speak to clinical relevance of any of the effects, does not deal with multiple benefits or multiple risks, or any of the trade-offs between the benefits and risks" (European Medicines Agency, 2013a).
The metric is restricted to binary endpoints, limiting the range of benefit and risk criteria that can be included. The advantage of this is that the statistics involved are simplified, particularly when exploring uncertainty. This has facilitated the development of probabilistic extensions to the basic NNT/NNH approach (Sutton et al., 2005).
Impact numbers
Impact numbers are useful descriptive tools when focusing on a single benefit or risk criterion (or very few criteria). As noted in the Wave 1 rimonabant case study, "the results from the analyses are directly applicable to the population of interest where the context can be placed immediately in terms of number of people who would be affected by the decisions." This makes impact numbers appealing as a tool for communicating the consequences of particular courses of action (e.g., to provide additional transparency and support for regulatory decisions).
As decision making tools, however, impact numbers appear less attractive, particularly for problems involving multiple benefit and risk criteria. However, the method may be useful for public health practitioners investigating the impact of interventions at the population level, such as vaccination programmes. There is no integration of benefits and risks, making complex problems difficult to digest. As with NNT/NNH, impact numbers use "the same unit for both benefit and risk criteria, but the scales may not be directly comparable" (the Wave 1 rimonabant case study), presenting a danger that inappropriate comparisons will be made. The potential for misapplication is increased by the fact that there are several impact numbers with different interpretations and there may be confusion as to which is the most relevant in any given situation.
Similar to NNT/NNH, impact numbers can only be defined for binary endpoints and ignore preference values.
Benefit-Risk Ratio (BRR)
BRR requires a single measure for "benefits" and a single measure for "risks." It may, however, be applied to problems involving many criteria, either by focusing on the key benefit and key risk (as in the Wave 1 efalizumab case study and in the Wave 1 rimonabant case study), or by using an integrated measure for benefits and a separate one for risks. None of the case studies attempted the latter approach, although it might be appropriate in disease areas where integrated benefit and risk measures are routinely collected.
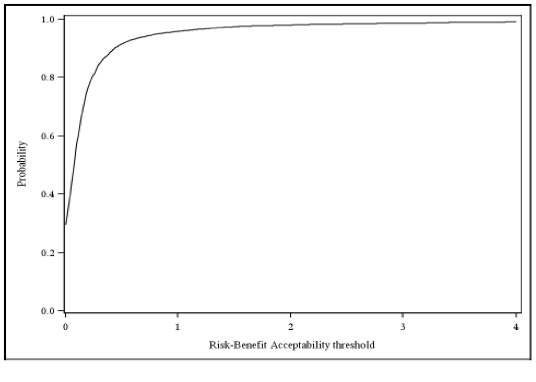
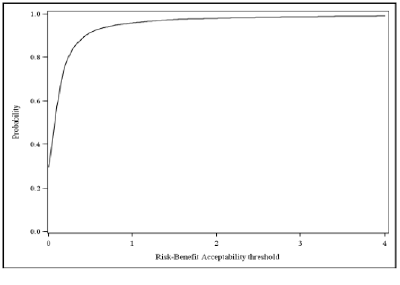
It is important to consider the interpretation of the benefit-risk ratio in terms of the relative value of the benefits and risks that have been included. For the purpose of transparency in decision making, it is good practice to make this value judgement explicit by defining an "acceptability threshold" or "acceptability curve." (An example from the Wave 1 telithromycin case study is shown below in Figure 8.)
Figure 8 Benefit-Risk acceptability curve for the probability that telithromycin is net-beneficial relative to comparator at any risk-benefit acceptability threshold. For example, if preferences were such that one is willing to accept 1 risk event to 1 benefit event, the probability that the drug provides a net benefit is 0.96
Unless the benefit-risk ratio is very large, adding information on the INHB can provide useful complementary information.
Which quantitative frameworks were identified and reviewed by PROTECT WP5?
Which quantitative frameworks were identified and reviewed by PROTECT WP5?
NNT/NNH is characterised by its simplicity, which presents both advantages and disadvantages.
Nine (9) Quantitative Frameworks were identified as:
- BLRA
- CUI
- Decision Tree
- DI
- MCDA
- MDP
- NCB
- SBRAM
- SMAA
Further details are provided on each of these frameworks here
Which quantitative frameworks were evaluated in the case studies?
Which quantitative frameworks were evaluated in the case studies?
MCDA and SMAA were recommended to be taken forward for benefit-risk assessment execution methodologies. MCDA is a sound and flexible framework for integrating multiple benefit and risk criteria based on their perceived value, and using this as a basis for comparisons between alternative treatments.
SMAA is an extension of MCDA that incorporates probabilistic modelling of the treatments' performance data and does not require the weighting of benefits and risks to be specified a priori - instead, it explores all possible combinations of weights.
Two quantitative frameworks that were not recommended by the Methodology Review (Mt-Isa et al., 2012) were also applied in at least one case study: relative-value adjusted Number Needed to Treat (RV-NNT) and Sarac's Benefit-Risk Assessment Method (SBRAM).
RV-NNT is an extension of the NNT metric that allows weighting of multiple benefits and risks (Holden, 2003). The Wave 1 natalizumab case study team demonstrated that RV-NNT is equivalent to a preference-weighted implementation of another quantitative framework, Net Clinical Benefit (NCB). RV-NNT is a quantitative framework that compares the overall difference in favourable and unfavourable effects, and also corresponds to a special case of the more general MCDA framework.
Sarac's Benefit-Risk Assessment Method (SBRAM) is conceptually similar to MCDA but uses a simplified system for scoring and weighting. Each benefit or risk criterion is weighted as either high, medium, or low importance; and the difference between a treatment and its comparator with respect to each criterion is reduced to a trichotomous measure (treatment is inferior, treatment is superior, or no difference).
Table 9 shows the quantitative frameworks that were evaluated in each PROTECT WP5 case study.
Table 9 Quantitative frameworks tested in the PROTECT WP5 case studies
Case study MCDA SMAA RV-NNT / NCB SBRAM WAVE 1 Efalizumab Telithromycin Natalizumab Rimonabant WAVE 2 Efalizumab Telithromycin Natalizumab Rimonabant What are our recommendations regarding quantitative frameworks?
What are our recommendations regarding quantitative frameworks?
Multi-Criteria Decision Analysis (MCDA)
MCDA was found to be a highly effective methodology in all the case studies where it was used. Its systematic approach to breaking down complex problems facilitates "a transparent judgement of value between risk and benefit" (the Wave 1 rimonabant case study). The method "divides a complex problem into smaller criteria for assessment...this approach leads the decision makers to develop a deeper insight into the problem to be addressed as well as the alternatives to be considered" (the Wave 1 telithromycin case study).
MCDA works particularly well in conjunction with the PrOACT-URL descriptive framework, as it provides the technical means for completing many of the framework steps. The Wave 1 rimonabant case study team described MCDA as "a natural progression of PrOACT."
It is worth pointing out that MCDA is an umbrella term for a broad range of related (but distinctly formulated) approaches to decision making involving several criteria, and not all formulations have been evaluated by PROTECT WP5 (Figueira et al., 2005). The Wave 1 telithromycin case study team observed that it is important to be "clear in our mind that there are many adaptions to this framework, and we have only tested one adaption." The differences between the forms of MCDA generally relate to the technical details of the underpinning theory, however. The MCDA framework that the PROTECT WP5 case study teams used is based on decision theory, and there are various ways to realise and apply that theory. There are other methods and theories that claim to be MCDA but that are not actually based on decision theory; and if these are to be applied, it is important to understand their underlying constructs (Belton and Stuart, 2002).
Most of the case study teams used the Hiview software to implement MCDA. This software was generally found to be efficient and easy to use, and its ability to produce key visualisations was appreciated, as noted by the Wave 1 efalizumab case study team: "MCDA is applied in the Hiview3 software with several graphical representations (Effects Tree, various coloured bar graphs) which provide easily understandable visualisation of results. This is easily provided by the software itself."
The Wave 1 telithromycin case study identified a significant limitation of Hiview3: The software only allows a single value for each benefit or risk, so it cannot directly "account for the uncertainties and random error with the statistical estimatesa?|this is crucial in making medical judgements." However, it is possible to implement MCDA in a variety of software packages, including spreadsheets, and many limitations of standard software packages can therefore be overcome, given sufficient resources. This may allow for direct handling of uncertainty within the MCDA model; if such an implementation is not possible, then we recommend that the sensitivity of MCDA results to uncertainty is thoroughly investigated at the Exploration stage.
A major strength of the MCDA framework is that each benefit or risk can be expressed using any measure, as long as it is possible to convert the measure into a preference value or utility. This makes it particularly useful in benefit-risk assessments later in a product's life cycle, where the data for benefits and risks may be drawn from different sources and therefore compatibility of measures cannot be guaranteed. This was observed by the Wave 1 efalizumab case study team: "Extreme heterogeneity of measures (absolute numbers, proportions with various denominators) is manageable in MCDA, which is useful in a post-marketing evaluation where measures are very heterogenic in nature and in units." The Wave 1 telithromycin case study team noted that, in fact, "the MCDA model is also applicable where there are few or no objective measures but only preferences."
On the other hand, MCDA usually relies upon direct data which is then transformed to common units of preference values so it must be possible for stakeholders to attach values to the benefit and risk measures that are included. In practice, this means using absolute measures of the outcomes of treatments in the target population instead of the relative measures of treatment effect (ratios or differences between groups) that are frequently reported in the medical literature. For example, if it is known that 50% of patients taking a drug experience a particular adverse event, we can associate a utility score with this outcome. If, on the other hand, we only know that the relative risk of the adverse event is 5 (compared to patients who take placebo), we cannot translate this into a utility because we do not know the magnitude of the risk.
The Wave 1 rimonabant case study team suggested that preference information may be "difficult to obtain in real life, particularly when the number of criteria is large." There are practical considerations when trying to elicit preferences, such as the cognitive burden on an individual or group of individuals asked to make distinct comparisons within a large number of scenarios, perhaps within a short period of time. These problems may be partly or wholly due to unfamiliarity with what are relatively new methods, and can be mitigated by the use of an experienced facilitator. There is also the question of whether the preferences elicited by a particular group on any given occasion are representative of the views of all relevant stakeholders.
The Wave 1 telithromycin case study and Wave 1 rimonabant case study teams found that it was not possible to obtain precision in weights and suggested that this can be explored using SMAA, which shows the effects on the benefit-risk balance by exploring all potential combinations of preference weights. Of course, there is also uncertainty in the data, and this too can be explored in SMAA as well as in probabilistic simulation method (PSM) in general.
Another potential difficulty was noted by the Wave 1 natalizumab case study team: "Outcomes should be expressed in non-comparative terms (i.e., using measures observed in a particular population, rather than comparative measures such as risk ratios that relate to the difference between populations) as this is the scale [on which] preference values are expressed." By contrast, it is outcomes on a comparative scale (i.e., relative to a comparator or no treatment) that are fundamental to the results of a benefit-risk assessment and most frequently reported in the medical literature. The requirement under MCDA to convert outcomes to an absolute scale for the purpose of preference elicitation may increase the complexity of analysis, particularly if complex data networks or probabilistic models are employed. The multiple steps involved in transforming outcomes, converting to utility scores, and weighting may increase the opportunities for bias to creep into the analysis. The above use of the term "absolute" should not be confused with the term as it is used in measurement theory, where it simply refers to the measurement of numerousness, as in counting the number of patients who experienced a side effect. In general, when measures of effects are combined to give overall results, meaningful interpretation of the results expressed as ratios requires ratio-scale data (arbitrary unit) on all effect data. Results expressed as differences can be based on any mixture of interval-scale data (arbitrary unit and zero point) and ratio-scale data. Utilities are assessed as interval scales, so ratios of utilities can be misleading (Krantz et al., 1971).
Stochastic Multi-criteria Acceptability Analysis (SMAA)
SMAA attempts to overcome two of the most commonly cited shortcomings of standard MCDA models: It allows for flexibility in the handling of performance estimates and preference information. Performance estimates can be input as point estimates or using a distribution. Preferences can be input as missing, ordinal (i.e., outcomes are ranked), or cardinal (i.e., the exact value or the interval of the preference data can be specified). Distributions can be used to describe the performance estimates and preference information in an SMAA model, which allow for: (a) the incorporation of uncertainty in the performance of a treatment, e.g., the effect of confidence intervals on the decision can be investigated, and/or (b) the incorporation of uncertainty in preferences, e.g., the effect of varying preferences can be accommodated if stakeholders do not come to consensus. Instead of calculating the best option with a given set of data and preferences, SMAA estimates the probability that each comparator is the best option available conditional on the probability of different data and preference information.
The Wave 1 rimonabant case study used specialised J-SMAA software, which is available free online (a version still in development was used by the PROTECT WP5 case study teams, who discovered limitations in the current version). It is also possible to implement an SMAA-style approach in other packages: The Wave 2 rimonabant case study developed STATA code and a Microsoft Excel?? spreadsheet for this purpose, and the Wave 2 natalizumab case study used WinBUGS to allow for uncertainty of clinical data (but not preference weights). However, a custom-built implementation such as these will require statistical expertise, whereas J-SMAA may be more suitable for naive users " though this can lead to errors in interpretation if the user does not understand what is going on "under the hood." There may be implicit assumptions that are important to consider when presenting the results. For example, it is typical to assume that the different benefit and risk criteria, although variable, are not correlated in any way; in other words, the expected score for each benefit or risk criterion is not affected by the scores on the other criteria. In reality, one might expect some of the benefits or risks to be correlated, as noted in the Wave 1 telithromycin case study report: "The performances of an alternative on different criteria are likely to be correlated. Currently, they are taken as independent in SMAA simulations. .. It is not clear how much the correlation affects the results."
The use of SMAA is recommended in the following situations:
- To investigate the impact of uncertainty on an existing MCDA model;
- To model the distribution of the benefit-risk balance based on patient-level data; or
- When clear preference information is missing or when a consensus cannot be reached.
Documenting preference information which has been elicited from stakeholders is desirable for transparent benefit-risk assessments. Therefore, we believe it is appropriate to elicit weights where possible and to supplement this approach with SMAA if necessary to demonstrate robustness to variability (as suggested by the Wave 1 rimonabant case study team: "Although precise weighting information is not needed ... A decision conference would be useful to elicit the stakeholder preference between criteria to examine the sensitivity of the model.").
Relative-Value Adjusted Number Needed to Treat (RV-NNT) and Net Clinical Benefit (NCB)
RV-NNT has been developed as an extension of the NNT/NNH family of indices that allows multiple benefits and risks to be considered simultaneously and weighted according to elicited preference values (Holden, 2003).
Net Clinical Benefit (NCB), as described by Sutton et al. (2005), is a measure of the difference in favourable and unfavourable effects between two treatments. NCB is defined as the sum of the difference in benefits minus the sum of the difference in risks; however, the framework is flexible with regard to how the benefits and risks are measured and summed.
The Wave 1 natalizumab case study team observed that the RV-NNT framework can be seen as an implementation of NCB with explicit preference weighting. Furthermore, it is equivalent to a special case of MCDA in which every benefit or risk outcome is expressed as a binary variable with a particular form of linear value function. The method is recommended as long as these restrictions are considered appropriate.
Sarac's Benefit-Risk Assessment Method (SBRAM)
Sarac's Benefit-Risk Assessment Method (SBRAM) was designed for use by pharmaceutical companies during the drug development process (Sarac et al., 2012). SBRAM is an extension of MCDA that uses 3-point scoring and weighting systems. A drug is scored relative to a comparator on each criterion as superior (+1), non-inferior or equivalent (0), or inferior (-1). Scoring rules are established for both discrete and continuous data. A simple approach to uncertainty provides for scores to be expressed as intervals. Criterion weights appear to represent the relative importance of the effects, with "a weight/importance of 1 (low), 2 (medium), or 3 (high)." Scores are multiplied by weights to give weighted scores that can range from +3 to -3, or as an interval. These weighted scores are displayed as a tornado-like diagram, with sections coloured to indicate inferiority, non-inferiority, or superiority of the drug for each effect.
As this particular application is not within PROTECT WP5's remit, we have not carried out extensive testing of SBRAM. However, it was evaluated in the Wave 1 telithromycin case study. This case study team found the method to be quite demanding in terms of the statistical work involved ("the process of scoring criteria is not straightforward for layman and there exists no finished software for the methods") and also noted restrictions on the form and source of evidence (the data for each benefit or risk must be drawn from a single trial and "the method cannot (in this development stage) accommodate input from Meta-analysis").
On a more fundamental level, simplified scoring systems such as that used in SBRAM have been criticised elsewhere, as they discriminate poorly between alternatives and may increase the potential for bias (Nutt et al., 2010).
Overall, PROTECT WP5 does not recommend SBRAM as a tool for benefit-risk assessment during later-phase trials or after marketing registration.
Which utility survey techniques were identified and reviewed?
Which utility survey techniques were identified and reviewed?
Four Utility Survey Techniques were identified as:
- Stated Preference Method
- Contingent Valuation Method
- Conjoint Analysis
- Discrete Choice Experiments (DCE)
Further details are provided in here.
Which utility survey techniques were evaluated in the case studies?
Which utility survey techniques were evaluated in the case studies?
Based on the results of the Methodology Review (Mt-Isa et al., 2012) (as noted in Appendix 10), Conjoint Analysis and Discrete Choice Experiments (DCE) were recommended to be applied in the case studies.
Conjoint Analysis / Discrete Choice Experiments
Both conjoint analysis and discrete choice experiments are versions of stated preference methods. To apply either approach, participants in elicitation sessions are shown two different items to be compared.?? Each item is defined by a specific level of achievement on each criterion that is relevant to the item, such that the combination of levels on item A is different from the combination on item B. As applied to drugs in PROTECT WP5, the criteria are the favourable and unfavourable effects, and the levels of achievement are possible realised performance of a drug for the effects. Many possible drugs are then generated, and assessors are asked to compare two different drugs at a time, stating which of the two they prefer. From many preference statements about many pairs of hypothetical drugs, criterion weights and utilities or preference values can be calculated.
Swing weighting is perhaps the most direct Conjoint Analysis method. The first step is to define the range of values for the benefit and risk criteria by choosing realistic "worst" and "best" outcome for each criterion. Participants are then asked to imagine that all benefits and risks are at the worst score and to choose the outcome they would most like to move to the best score. They are then asked, "How big is the worst-best difference on this criterion, and how much do you care about it?" on this criterion compared to the one with the biggest swing. This is a "thought stepping stone" for putting preference weights on these outcomes. For this, the top ranked criterion is given a weight of 100, and the participants assign weights to the other criteria to reflect their relative importance.
Analytic Hierarchy Process (AHP) breaks down the problem into a set of pairwise comparisons between clusters of benefit and risk criteria. Participants are asked to judge the relative importance of each pair of criteria on a numerical scale from 1 (equally important) to 9 (extreme preference for one criteria). AHP assesses the consistency of these pairwise judgements and translates them into unitless priority numbers (weights, preferences, or likelihoods, depending on what questions are asked of the assessors) that range from 0 to 1.0.
MACBETH (Measuring Attractiveness by a Categorical Based Evaluation Technique) does not require participants to assign numerical values. Instead, the difference in attractiveness between each pair of benefit and risk criteria is expressed on the following categorical scale: neutral, very weak, weak, moderate, strong, very strong, and extreme. MACBETH assesses the consistency of these pairwise judgements and translates them into numerical preference values. If the question posed to the assessors is to compare the difference in worst-to-best attractiveness on one criterion with another using the same seven categorical difference descriptions, then the result is a set of relative importance weights for the criteria. In a similar fashion, value functions can be obtained with the categorical scoring technique.
Table 10 shows the utility survey techniques that were tested in PROTECT WP5's case studies (and by the PPI workstream, whose work developed out of an extension to the Wave 1 natalizumab case study).
Table 10 Utility survey techniques tested in the PROTECT WP5 case studies
Case study Swing weighting AHP MACBETH DCE WAVE 1 Efalizumab Telithromycin Natalizumab Rimonabant WAVE 2 Efalizumab Telithromycin Natalizumab Rimonabant What are our recommendations regarding utility survey techniques?
What are our recommendations regarding utility survey techniques?
It is recommended to hold a decision conference to organise the process of eliciting preference information for a benefit-risk analysis. This was the approach used in the efalizumab, telithromycin, natalizumab, and rosiglitazone case studies. A decision conference is a meeting between individuals representing key stakeholder views, where the importance of the benefits and risks is discussed and elicited using techniques like those in Table 10.
As noted in the Wave 1 rimonabant case study and the Wave 1 telithromycin case study, it is recommended that: "(1) Stakeholders selected for the decision conference need to be wide enough to accommodate views from different parties " regulators, physicians, and patients. (2) Information on criteria would need to be available for review prior to meeting."
Disagreements often arise between the stakeholders involved in a decision. The decision conference format facilitates debate and the sharing of relevant experience, which may help the team arrive at a consensus. If substantial disagreement persists, the effect of using different preferences for analysis can later be explored. Some utility survey techniques " including AHP, MACBETH, and DCEs " can be designed to incorporate more than one set of preferences and provide an average result and, in some cases, the distribution of results.
It is important that the patients' perspectives are considered in the benefit-risk assessment process. For example, patients can contribute their views about what benefits and risks should be included, and how relatively important each one of these is to them.
As a matter of being pragmatic, a team may choose to rely on internal expertise as a surrogate for specific external perspectives as this may be more efficient than finding external participants to represent stakeholder views. For example, the Wave 1 rimonabant case study used case study team members to represent the perspectives of physicians, non-physicians, and regulators based on their respective areas of expertise.
As noted in the Wave 1 efalizumab case study, it is recommended that: "The weight given to some outcomes would deserve thorough discussion on their medical relevance (e.g., reversibility of serious risks, long term continuation of short term benefit)."
As noted in the Wave 1 efalizumab case study, it is recommended that "structured and validated questionnaires should be developed and used for these methods." Questionnaires may need to include supporting material such as glossaries to explain any unfamiliar concepts, and these should be pitched at the correct level for the participants. Sufficient time should be budgeted for preparing and validating the supporting material.
What are our recommendations regarding the use of visualisations at the Analysis stage?
What are our recommendations regarding the use of visualisations at the Analysis stage?
Our recommendations regarding visualisations at the Analysis stage are set out below, grouped according to their specific purpose.
A relevant point throughout is that graphics must be well-designed for the intended audience. Higher level of education and perceived numeracy skills are associated with higher clarity and understanding of information on a visual display. Therefore, more work should be done when benefit-risk information needs to be communicated to audience with low perceived numeracy skills (Dolan et al., 2012).
Eliciting preferences
The use of visualisation methods for preference elicitation can reduce cognitive burden on the stakeholders, ensure proper understanding of the message, and engage stakeholders in the elicitation process.
Using a value-tree diagram to communicate the structure of the decision problem to the stakeholders is recommended for all elicitation methodologies. This should be supplemented where necessary by a glossary of the relevant medical terminology.
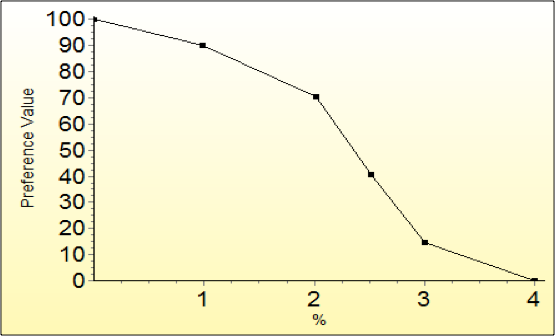
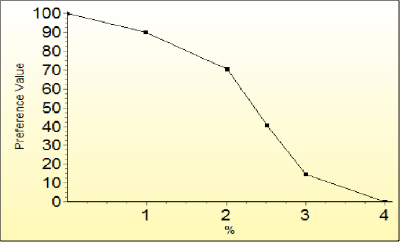
There are also specific visualisation methods that work well with particular elicitation methods. For example, Hiview3 provides an interactive graph whose data points can be dragged to the desired position in order to build a preference value function (Figure 9).
Figure 9 A non-linear value function for the percentage of patients who experienced congestive heart failure in a clinical trial.
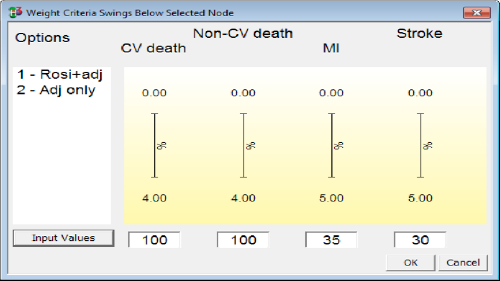
The standard method of weight elicitation in MCDA is swing-weighting, assessing the swing in preference from the worst to the best positions on a criterion scale. Thermometer-like displays make it easier to visualise the difference between worst and best so the largest clinically relevant swing can be assigned 100 and the other swings judged as ratios relative to 100 (Figure 10).
Figure 10 Swing weights as displayed in Hiview3 for four unfavourable effects criteria considered in the rosiglitazone case study.
MACBETH for Hiview3 makes use of an interactive table display to enable assessors to make judgements about differences in criterion-weights according to MACBETH's categorical scale (Figure 11).
Figure 11 The MACBETH interactive table in Hiview3 for eliciting qualitative differences in criterion weights.
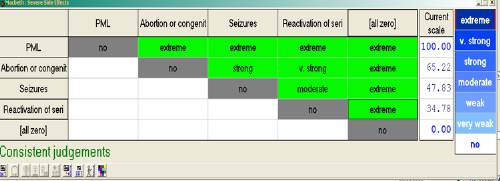
Consistency checks made on the categorical judgements as they are inputted help the assessors to provide reliable assessments and thus the integrity of the resulting MCDA model. An interactive thermometer scale is also used to visualise the resulting criterion weights, allowing users to fine tune their preferences about weights within their consistency bounds (Figure 12).
Figure 12 Thermometer scale of relative weights on node "severe side effects" from Macbeth

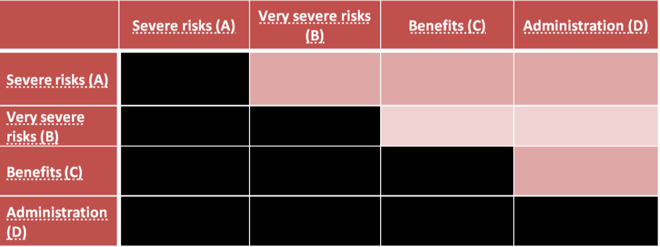
Figure 13 A typical table used for eliciting preference weights in AHP
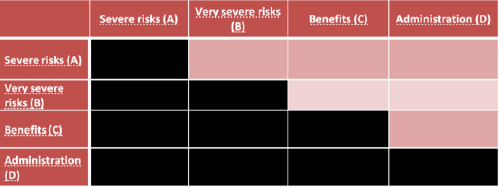
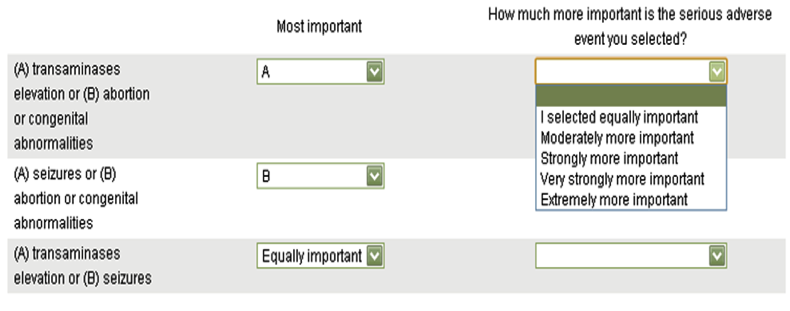
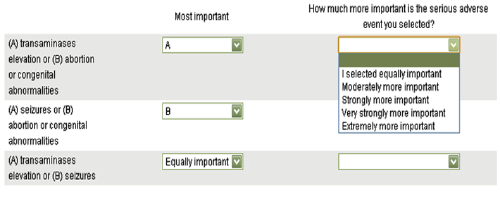
The analytical hierarchy process (AHP) has the least established visualisation method. One common technique is to present the criteria within a group in a matrix or table (Figure 13) to be compared directly, but users need to specify the direction of preference and assign quantitative preference values manually (typed in). We have developed an example of how this approach can be adapted by creating a web-based survey in SurveyMonkey (http://www.surveymonkey.com). This provides a user-friendly interface to replace the typical table. The quantitative values have also been replaced with categorical statements (right-most column in Figure 14) to help support judgement, but in this case, this comes at the expense of fewer categories for "importance" ratings. The advantage is that the interactive drop-down lists are likely to ease cognitive burden to the stakeholders. The categorical statements are later converted to the predetermined set of ordinal numeric values for analysis but are unknown to the responders at the time of answering the survey.
Our recommendations regarding visualisations at the Analysis stage are set out below, grouped according to their specific purpose.
What are our recommendations regarding the use of visualisations at the Analysis stage?','Figure 14 AHP drop-down list of response choices
Presenting results
The use of appropriate visualisations can speed up stakeholders\' response times when reading outputs from a benefit-risk analysis.
Qualitative or partially quantitative analysis
To present the results of a qualitative or partially quantitative analysis, a table or forest/interval plot is recommended.
Tables provide fast and efficient readability across issues displayed in rows and columns. They can serve as a common means for benefit-risk communications because of their simple structure, flexibility, and the ease with which they can be adapted. Although some individuals may not intuitively think of tables as a form of visual representation, tables can be very powerful as a communication tool whilst also conveying a substantial amount of information. They can be used when communicating benefits and risks to all audiences including the general public, mass media, patients, doctors, regulators, and other experts such as analysts.
The ability to comprehend tables is highly dependent on the verbal and numerical format of the display. For tables representing summary statistics and specialist benefit-risk metrics, a statistical background may be required. Likewise, tables loaded with medical terms require some medical knowledge to be understood.
Good tables ease cognitive burdens of users and decrease the time required to extract the information. Tables should be limited to the requisite number of rows and columns to avoid adding cognitive burden when reading tables. since the information appears by lines and inevitably would be read as such. There may also be some issues of overlapping information presented in a table; e.g., when presenting events which are not mutually exclusive such as measuring \"all deaths\" and \"death from cancer\" in an analysis leading to double-counting the (latter) events. The existence or non-existence of hierarchies and overlapping information should be clarified when presenting information in tables, such as by accompanying tables with a tree diagram to visualise hierarchy or a Venn diagram to visualise inclusivity.
Figure 15 PrOACT-URL 'effects table' listing the criteria for the benefit-risk assessment model in the Wave 1 efalizumab case study
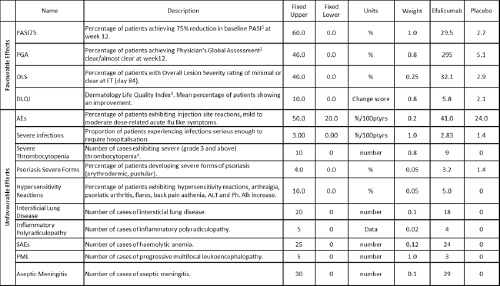
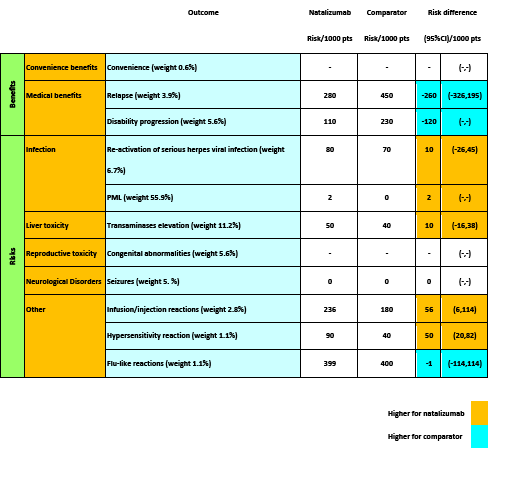
Figure 16 BRAT 'source data table' listing the data for benefit-risk assessment model and their source in the Wave 1 natalizumab case study
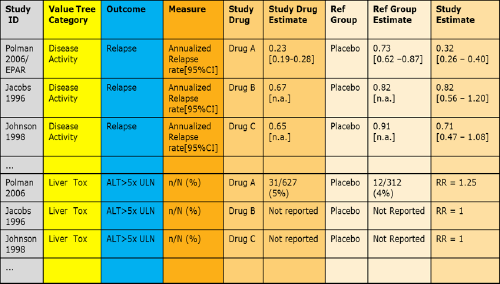
Figure 17 Example of a table showing increased risk of headaches and nausea caused by taking pills (reproduced from Hawley et al., 2008)
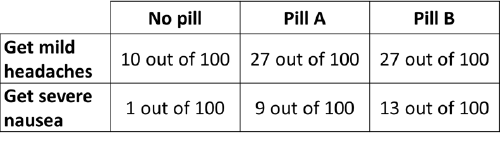
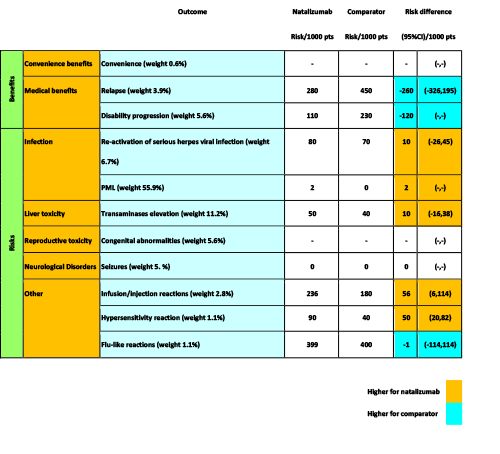
Figure 18 A colour-coded table within BRAT framework as applied in Wave 1 natalizumab case study
Quantitative analysis
To present the results of a quantitative benefit-risk assessment, a bar chart is recommended.
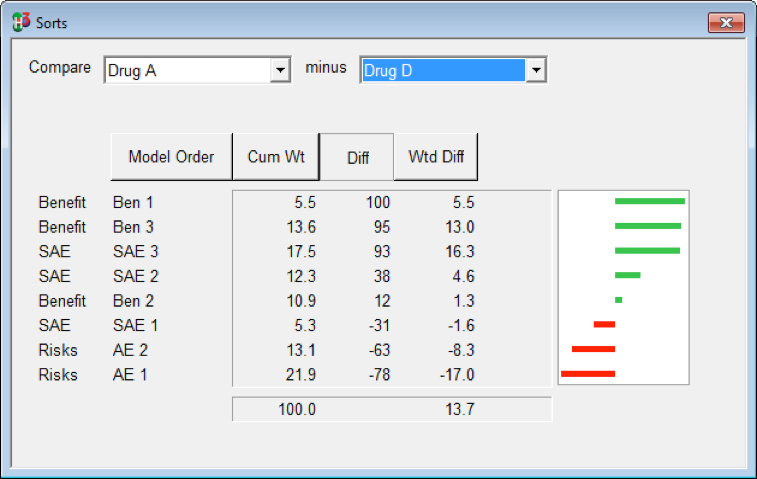
Bar charts come in many types. Several examples are shown in Appendix 11. Bar charts can be used to communicate magnitude of any measure (e.g., benefit-risk score, probability of outperforming a comparator). Stacked bar charts can be used to depict proportions. Bar charts can also be used to display the benefit-risk trade-offs and to compare between options (stacked bars), as in the MCDA software Hiview3. A specific application of a bar chart within Hiview3 is known as the "difference display," where the bars are indicative of the difference in benefit and risk scores between two treatments (Figure 19). This is a particularly important visualisation because of the comparative nature of benefit-risk assessment.
Figure 19 An example of a difference display from Hiview3

Bar charts may be suitable to be used as a visual communication tool to a large variety of audiences such as the general public through the media, patients, physicians, regulators, and other experts. The \"difference display,\" in particular, has been found to be a very useful visualisation of benefit-risk balance in regulatory decision making (European Medicines Agency, 2012). Any medical terminologies used obviously require some explanation if presented to an audience with no medical knowledge.
When a quantitative benefit-risk assessment approach is used, we recommend that stakeholders\' value preferences (i.e., the weights of the benefit and risk criteria) and the magnitudes of the final benefit-risk metrics should be visualised using simple or stacked bar charts. The importance of presenting the preference weights should not be overlooked; as we have already mentioned, this information is key to interpreting an integrated benefit-risk metric.
To visualise the contributions of the different benefit and risk criteria in the benefit-risk analysis, the use of stacked bar charts, difference displays, or grouped bar charts is recommended.