-
Evidence Gathering and Data Preparation: Summary of Key Points
Evidence Gathering and Data Preparation
This stage of the process concerns the identification and extraction of evidence relevant to the benefit-risk assessment, and data are needed on the performance of each alternative treatment in relation to each of the benefit and risk criteria. When preparing data, it is important to anticipate the methods that will be employed at the Analysis stage of the benefit-risk assessment process, as this may determine the form of the data that are required. We recommend that statistical and epidemiological expertise is engaged to ensure that data are handled appropriately. Clinical expertise is required to ensure that appropriate judgements are made regarding the relevance of benefits and risks criteria, and so that risk management options can be identified upfront.
The source data should be clearly documented, together with details of any manipulations that are applied to make the data suitable for the planned decision analysis model. The documentation should be sufficiently clear to enable the data preparation process to be replicated by others.
Summary of key points
- The Evidence Gathering and Data Preparation stage of the process concerns the identification and extraction of evidence relevant to the benefit-risk assessment.
- We recommend that clinical, statistical, epidemiological, and database expertise is engaged at this stage.
- The source of data should be clearly documented and justified for inclusion or exclusion, and be sufficiently clear to enable transparency in the data preparation process.
- Relative to deciding which sources of evidence to use, it is recommended that decision makers are aware that the sources of evidence:
- must be appropriate and sufficient to the decision problem
- can be aggregated if multiple studies are involved
- may be aggregated using different weights according to their perceived reliability
- should match criteria definitions and time horizon as closely as possible
- should be based on a population of patients that resembles as closely as possible the population that will be affected by the medicinal product
- It is recommended that the decision maker be prepared to discuss the available sources of evidence with other stakeholders in order to reach agreement as to which sources of evidence are most appropriate to be used in a benefit-risk assessment.
- It is recommended that future uncertainties and likely scenarios should also be considered in the preliminary benefit-risk assessments.
- Data from the sources of evidence must be extracted and expressed in the appropriate, well-defined metric(s) for the anticipated method of analysis.
- Data extraction may be straightforward if a single evidence source provides all the measures that are needed and in the correct form for analysis; however, prior to analysis, some data may:
- need a mathematical transformation which should be documented
- need to be combined if there is no single source of evidence that can provide data on the performance of each comparator in relation to all of the benefits and risks
- be combined to make efficient use of all the available evidence, resulting in more accurate estimates and less uncertainty in the data
- be aggregated based on expert opinion (e.g., by a panel of clinicians considering the evidence and forming an opinion as to the appropriate parameter value and documenting the rationale), or on a statistical basis using meta-analytical techniques
- If there is no reliable evidence for a particular benefit or risk criterion, the recommended options should be to:
- consider using a different criterion definition or a surrogate criterion for which data are more readily available
- leave the criterion in the model and explore the sensitivity of the results to different assumed values [Our recommended option]
- consider using a different method of analysis that is more compatible with the available data
- decide it is acceptable to omit the criterion from the analysis if it is not thought to be essential to the benefit-risk decision
- Estimation Techniques may be required when dealing with complex data or multiple sources of evidence in order to transform source data into a suitable form for benefit-risk assessment. Probabilistic Simulation Method (PSM) and Indirect/Mixed Treatment Comparison (ITC/MTC) were specifically evaluated in the case studies.
- Three visualisation techniques were identified as being useful at the Evidence Gathering and Data Preparation stage:
- Structured and colour-coded tables of evidence data and sources
- Network graphs of the relationship of evidence data and sources
- Forest plots of the evidence summary
- At the end of the Evidence Gathering and Data Preparation stage, decision makers should have identified all available data, aggregated them into suitable formats for analysis, and should have a clear idea of the types of analysis that are feasible given the data; as well as having finalised the criteria on the value tree to be used in the model, e.g., a key benefit-risk summary (KBRS) table or effects table.
-
What steps are involved in evidence gathering and data preparation?
What steps are involved in evidence gathering and data preparation?
This stage of the benefit-risk assessment process can be further broken down into the following important steps:- Identifying sources of evidence
- Deciding which source(s) of evidence to use
- Extracting the data for analysis
- Data transformations
- Aggregating multiple sources of evidence
- Dealing with missing data
Identifying sources of evidence
The availability of evidence regarding a medicine's effects may depend on who is carrying out the benefit-risk assessment, and hence the quantity, form, and quality of the available evidence relative to the point the medicine has reached in its life cycle. The need for evidence regarding the comparators should not be forgotten. We were limited to publicly available data for various reasons, including the fact that the case studies were all based on existing historical regulatory decisions and the possibility for subsequent research to be performed based on the same datasets. However, outside of the PROTECT context, decision makers (e.g., Industry or Regulatory Agencies) will have in practice to use both published and internal, or unpublished data. Therefore, adopting an extensive standpoint, typical sources of evidence include:- Clinical/epidemiological studies: The body of literature on any given drug will accumulate over time, so the use of published data is well suited to benefit-risk assessments carried out during the later phases of the life cycle in addition to existing controlled data. However, Regulators and Industry may sometimes have access to and have to use data on file which are not yet publicly available. Double-blind clinical trials are the gold standard, but observational studies can also play an important role (e.g., the Wave 1 natalizumab case study used estimates of the incidence of PML based on observational data in the post-marketing setting; the Wave 1 efalizumab case study, for the same risk criteria of PML, used only spontaneously reported cases). This exemplifies the fact that, whilst clinical trials are the most efficient way for collecting efficacy data, some post-marketing situations may have to rely on less controlled data (see below Publicly-held Safety databases). The Wave 2 rimonabant case study, a post-marketing study in the UK, was used to estimate the incidence of psychiatric disorders. However, there are some aspects of published studies that can make their use frustrating for benefit-risk assessment purposes:
- The published endpoints are usually few in number and may not correspond to the benefit and risk criteria that were selected for analysis. For example, in the Wave 2 rimonabant case study, the only endpoint available in the post-marketing study was psychiatric disorders. None of the benefits were analysed in the same publication.
- The level of detail reported for each outcome may be insufficient for some analyses, particularly for the exploration of uncertainty. As noted by the Wave 2 rosiglitazone case study team: "Authors of publications often report only sample sizes, means, confidence intervals, and significance levels. Whilst this may be sufficient for making statistical inferences, it may not be adequate for the purposes of an MCDA, particularly for sensitivity analyses."
- Data at the patient level (i.e., a record of all the relevant outcome measurements for each individual patient) is rarely made publicly available, but this does not prevent a decision maker (Regulator, Company) having access to non-publicly available individual data to include these in a benefit-risk assessment if this is relevant. This can facilitate exploration of aspects of the problem, such as variability, individualised benefit-risk assessment, and correlation of outcomes.
- The number of publications may be small for various reasons. For instance, the time window between approval and withdrawal may be too short to allow many studies to be performed and published. For example, in the Wave 2 rimonabant case study, there was only one published study for each drug being compared (orlistat, rimonabant, and sibutramine).
- Some uncontrolled data from post-marketing experience (e.g., spontaneous reports) may be difficult to incorporate statistically, despite providing information on key risks. This was exemplified in some case studies where the major risk was a very rare but very serious condition (e.g., PML in the Wave 1 efalizumab case study). Issues relating to post-marketing data are also discussed in the Conclusion and Dissemination section of this report.
- Public registration documents (e.g., EPARs, PSURs, PADERs, DSURs) are a convenient summary of the data from pivotal studies and were used extensively in the case studies.
- It may be important to note that EPARs in their current form are insufficient and unfit as a sole data source for benefit-risk assessment. They may also tend to be over-inclusive and generally discursive to be transparent as to which are the important data that inform the benefit-risk assessment and consequently the decisions.
- Our case studies extracted data for analysis from the originally published pivotal studies identified through EPARs where possible.
- Publicly- and privately-held databases can provide extensive data at the patient level, but access may be limited. If a benefit-risk assessor wishes to use a database that is not administered in-house, it is important to consider:
- how access will be obtained
- any training or software requirements for the extraction of data
- the length of time it would take to obtain access to these databases
- Spontaneous reports of adverse events can provide data relevant to the ongoing benefit-risk assessment of a marketed drug. Despite many limitations such as under-reporting (Belton, 1997), and incomplete numerators and denominators (Clarkson and Choonara, 2002; Sacristan et al., 2001), spontaneous reports are often the only source of information of very rare but serious adverse events, allowing more detailed investigations (e.g., efalizumab PML cases).
Deciding which source(s) of evidence to use
In cases where the evidence is sparse, decision makers may have no choice but to use what little data are available. At the other end of the scale, for certain benefit-risk decisions, there may be an overwhelming amount of evidence. For example, in the Wave 2 warfarin case study, which considered a drug with a long history, a systematic literature review identified 37 relevant publications after a manual screening of the full text, but data were extracted from only a subset of these. This is also an example where an assessor may have to face the issue of low quality data, as much of the data on benefits and risks of warfarin pre-dates the GCP era.
Not all of the identified sources of evidence will necessarily be used to inform a decision. Decision makers should aim to ensure that the sources of evidence are appropriate to the decision problem:
- The outcome definitions and time horizon should match as closely as possible the value tree that was prepared at the Planning stage (e.g., in the Wave 1 rimonabant case study, a few trials were not used either because the outcome (smoking cessation) was not close enough to the value tree agreed by team members or because the length of the follow-up was too short).
- The population of patients from which data are drawn should match as closely as possible the population that will be affected by the benefit-risk decision.
- Any evidence whose reliability is doubted on either clinical or statistical grounds based on GCP standards should be excluded or given less weight relative to other more reliable evidence (e.g., in the Wave 1 natalizumab case study, a clinical trial was excluded due to concerns regarding its methodology and small sample size).
- Spontaneous reporting data may need to be used to address emerging risks which may not be available elsewhere; and the reliability of data and uncertainty from this source is to be addressed and documented. There are frequent situations (e.g., this is routine for the PRAC at EMA) where a benefit-risk assessment would have to be reviewed/updated based only on signal detection activity from spontaneous reports.
This is not to say, however, that each parameter in a benefit-risk model should be based on a single source alone. Data from multiple studies can be aggregated on either an impressionistic or statistical basis. This may be done in a way that gives different weights to different sources of evidence according to their perceived reliability (e.g., clinical trials may be given more weight than observational studies as they may be less prone to bias) (GAO-PEMD, 1992). Alternatively, the problem could be assessed using more than one dataset to investigate the effect of including or excluding particular sources of evidence.
By choosing between multiple sources of evidence, assessors may unwittingly introduce bias into a benefit-risk assessment. Furthermore, published sources of evidence may be unrepresentative of the true clinical effects of a treatment owing to the well-known phenomenon of publication bias (Dickersin et al., 1987; Easterbrook et al., 1991). For these reasons, and to increase the overall transparency of the Evidence Gathering stage, assessors relying on published studies should consider carrying out a systematic review. This would involve specifying a priori a literature search protocol that sets out the inclusion and exclusion criteria that will be used together with details of how multiple evidence sources will be aggregated and whether any allowance will be made for publication bias.
The key to a good benefit-risk assessment lies in the representativeness of the data used in the benefit-risk framework / decision model and in the transparency with which the assumptions / decisions for inclusion / exclusion of data and their uncertainties are documented.
Whilst experimental data from clinical trials provide the "efficacy" (effects in perfect conditions) of a treatment as the benefit endpoint, the evidence from clinical databases can provide the evidence of "effectiveness" (effects in real life). Efficacy from a clinical trial may not be observed in real life use of drugs due to many external factors that cannot be controlled (Eichler et al., 2011).
Furthermore, the true benefit-risk balance emerges over time, not as a static "snapshot" as at the time of marketing authorisation applications. Similarly, some risks or adverse events may occur immediately and others may take longer to surface. This brings in the complications of the discordant timing of benefits and risks where it may take longer to observe the benefits or risks of a treatment, and these may not be observed within the trial period. These issues have been known to be the limitations of clinical trials. This is further discussed in the Exploration section.
There are many public clinical databases such as the Clinical Practice Research Datalink (http://www.cprd.com), The QResearch (http://www.qresearch.org), The Health Improvement Network database (http://www.ucl.ac.uk/pcph/research-groups-themes/thin-pub/database), and the Health Informatics Centre (http://www.dundee.ac.uk/hic/) in the United Kingdom alone. Vast amount of data from primary and secondary care are collected routinely in these databases, and can be and have been used for benefit-risk assessment of medicines. Observational data from these databases may be a good alternative but are not free from limitations:- the larger uncertainty related to the accuracy, bias, and confounding
- the consistency of records varies and is also often questionable
- benefit endpoints that are recorded are limited; more serious events like myocardial infarctions and deaths are likely to be well-recorded, but less serious ones such as recovery from a symptomatic disease may not be recorded at all
- risks or adverse events may be captured through recorded medical complaints
- the severity of adverse events is not generally recorded
- the timing of the clinical events recorded may not be accurate due to the timing patients actually started experiencing adverse events to the time seeing the physicians
Therefore, when using these types of data sources, close collaboration with experts familiar with the strengths and limitations of the database information is recommended.
Bearing the above points in mind, input should be sought from stakeholders in order to reach agreement as to which evidence is most appropriate as they may not be able to rely on the conclusion of a benefit-risk assessment if they do not trust the evidence on which it is based.
In real life benefit-risk assessments, the circumstances are more complex than just identifying and using suitable evidence for the benefit-risk outcome measures. The process of identifying evidence itself is also important and should be made transparent. Justifications for the strategy utilised to find sources of evidence and evidence selection should also be documented to minimise biases. Future uncertainties and likely scenarios, e.g., as required by the EU Risk Management Plan (RMP) (CHMP/EMA, 2005), should also be considered in the preliminary benefit-risk assessments to accommodate accumulating future data. Addressing hypothetical scenarios, and past and future linked decisions would allow more informed decisions to be made, and consequently, could lead to better minimisation of risks in drugs use.
In the interest of transparency, any data potentially relevant for benefit-risk assessment (according to the final Value Tree) but not actually used in the final benefit-risk assessment for any reason should be precisely described and the reason given for not using it.
Extracting the data for analysis
Once the sources of evidence have been identified, the data must be extracted and expressed in the appropriate metric(s) for the anticipated method of analysis.
If a single evidence source provides all the measures that are needed and in the correct form for analysis, then data extraction is extremely straightforward. In practice, however, the situation is complicated due to the need for:
- data transformations
- aggregating multiple sources of evidence
- dealing with missing data
- Data transformations
A data transformation is a mathematical manipulation of data numerical values that changes the scale on which the data are expressed. Transformations are needed when there is a mismatch between the way outcomes are defined or measured in the source data and the definitions and metrics that will be used for analysis. Stakeholders should endorse a method of analysis before data preparation can be completed. The need for data transformations may not be obvious to those without statistical expertise.
The Wave 2 warfarin case study provides an example of a data transformation due to a mismatch between the metric in the source data and the metric intended for analysis. The source data (from a published meta-analysis) reported treatment effects as odds ratios. However, as noted in the Wave 2 warfarin case study report: "For the purpose of benefit-risk assessment, odds ratio metric can be quite difficult to interpret, especially when balancing across different criteria with different underlying frequencies." Consequently, odds ratio of the treatment effect was transformed to risk ratio and risk difference.
The Wave 2 natalizumab case study provides an example of a data transformation due to a mismatch in outcome definitions. One of the key benefits was a reduction in the rate of disability progression, where disability progression was defined as deterioration in a standard quality-of-life score, sustained for 6 months. Some of the source data, however, used a different definition, with the disability progression needing to be sustained for only 3 months. As noted in the Wave 2 natalizumab case study report: "The proportion of patients undergoing disability progression was adjusted by a factor of 0.71 in the treatment group and 0.79 in the placebo group to allow for this, based on the results of a trial for fingolimod (another treatment for relapsing-remitting multiple sclerosis), which monitored both definitions of the outcome."
The second example above demonstrates how statistical assumptions often play a role in data transformations " in this case, the assumption was that the ratio between the two outcomes observed in the fingolimod trial would also apply to the other study populations. Statisticians should carefully consider the implications of any assumptions adopted, as inappropriate assumptions may introduce bias to the analysis, particularly if the comparators are not all subject to the same data transformations. The impact of varying the assumptions should later be investigated as part of the Exploration stage.
For the sake of transparency, it is good practice to document any data transformations used. For example, the Wave 1 efalizumab case study report included a table detailing the formulae of the data transformations to be used in the analysis.
Aggregating multiple sources of evidence
There may be no single source of evidence that can provide data on the performance of each comparator in relation to all of the benefits and risks. In such cases, it will be necessary to combine evidence from multiple sources.
Even for outcomes where data are already available from one source, there may be value in supplementing this with data from another source in order to arrive at a combined estimate. If performed appropriately, this makes efficient use of all the available evidence, and results in more accurate estimates and les
Aggregation of evidence can be done on an impressionistic basis, e.g., by a panel of clinicians considering the evidence and forming an opinion as to the appropriate parameter values (and documenting the rationale), or on a statistical basis using meta-analytical techniques. A technical overview of meta-analysis is beyond the scope of this report, but we later comment on the application of a specific technique, i.e., indirect/mixed treatment comparison. Good examples of data aggregation can be found in the Wave 2 rosiglitazone case study and the Wave 2 warfarin case study.
Aggregating data may not always be appropriate; however, different sources of evidence relating to the same treatment may be heterogeneous with regard to any aspect of study design including (but not limited to) the nature of the study (observational or RCT), target population, indication, disease severity, follow-up period, and dosage. When confronted with heterogeneous data, it may be more appropriate to assess the benefit-risk balance based on each evidence source separately and consider the relevance of any differences in the results.
Dealing with missing data
Usually only known benefits and risks will be included in a decision model. However, if a benefit or risk is deemed important, e.g., a risk that has been observed in other drugs in the same class, but little data have been collected regarding the treatment of interest or no reliable evidence can be accessed, the decision maker:- should consider using a different outcome definition or a surrogate outcome for which data are more readily available; this means revisiting the Planning stage and ensuring that the benefits and risks form a coherent, non-overlapping set
- may decide it is acceptable to omit the outcome from the analysis if it is not thought to be essential to the benefit-risk decision
- always has the option of leaving the outcome in the model and exploring the sensitivity of the results to different assumed values
- may consider using a different method of analysis that is more compatible with the available data We would generally recommend the third approach over the second, on the grounds that it increases transparency and avoids second-guessing the outcome of the analysis. Moreover, outcomes that are irrelevant to the benefit-risk decision should not have been included in the first place. Conversely, outcomes which are relevant to a benefit-risk assessment should not be left out only on the excuse that data are unavailable, unreliable, or in a format not supported by the chosen method of analysis.
-
What types of methodologies are available to help with the Evidence Gathering and Data Preparation stage?
What types of methodologies are available to help with the Evidence Gathering and Data Preparation stage?
Estimation Techniques may be required in order to transform source data into a suitable form for benefit-risk assessment. Estimation techniques range from the very simple, through to cutting-edge statistical methods for synthesis of complex data from multiple sources.
We have not reviewed well-established estimation techniques such as simple statistical transformations and basic meta-analysis (Sutton et al., 2000) owing to their familiarity. However, they are extensively applied in benefit-risk analysis, including in our case studies.
-
Which estimation techniques were identified and reviewed?
Which estimation techniques were identified and reviewed?
Five Estimation Techniques were identified as:- Directed Acyclic Graphs (DAGs)
- Probabilistic Simulation Method (PSM)
- Confidence Profile Method (CPM)
- Indirect/Mixed Treatment Comparison (ITC/MTC)
- Cross Design Synthesis (CDS)
-
Which estimation techniques were evaluated in the case studies?
Which estimation techniques were evaluated in the case studies?
Based on the appraisal execution results, two estimation techniques were recommended to be applied in the case studies:- Probabilistic Simulation Method (PSM)
- Indirect/Mixed Treatment Comparison (ITC/MTC)
PSM is a general framework for probabilistic estimation, and can be used to characterise the variability or uncertainty in the results of a benefit-risk model. It includes the well-established Monte Carlo method of sampling from statistical distributions a large number of times. PSM can characterise and quantify the uncertainty in the results of an analysis based on known probability distributions for the evidence data and assumptions.
Indirect treatment comparison (ITC) provides a statistical basis for drawing comparisons between treatments that have not been directly compared in the same study population. Mixed treatment comparison (MTC) is a generalisation/extension of ITC that allows integration of direct and indirect evidence. ITC/MTC is concerned with appropriately combining different pieces of evidence in order to warrant the results of an estimation or simulation model.
PSM and ITC/MTC were used in several case studies, as shown in Table 1.
Table 1 Estimation techniques tested in the PROTECT WP5 case studies
Case study PSM ITC/MTC WAVE 1 Efalizumab Telithromycin 
Natalizumab Rimonabant WAVE 2 Efalizumab Telithromycin Natalizumab Rimonabant -
What are our recommendations regarding the use of these estimation techniques when gathering evidence and preparing data?
What are our recommendations regarding the use of these estimation techniques when gathering evidence and preparing data?
Probabilistic Simulation Method (PSM)
Interpreting the results of PSM will be discussed in the Exploration section, whilst this section deals with the extraction of source data for use in such a probabilistic model.
PSM is flexible enough to be used with any model and any combination of benefit and risk outcomes provided the distribution of each uncertain outcome can be characterised when preparing data. Some users may find this is more demanding in terms of resources and statistical expertise than simply extracting average data values. Selecting a statistical model requires careful consideration of the sources of uncertainty that are of interest and how they can be characterised given the available data.
For example, the Wave 2 natalizumab case study used a model that allowed for sampling error in the average outcome values but did not characterise the full variability of responses that would be seen at the patient level. The Wave 1 rimonabant case study, by contrast, did allow for variability of binary outcomes at the population level. These two examples were both based on summary data from published studies.
Patient-level data, if it is available, is likely to be very useful when attempting to characterise variability at the patient level, particularly if correlations between outcomes are to be taken into account. However, it is frequently unavailable to the public in its entirety, largely as a result of privacy laws that restrict the sharing of data points that could compromise the identity of the individual patient or violate the terms of informed consent. Anonymised patient-level data often can be shared. Out of the case studies, only the Wave 2 warfarin case study had access to patient level data from a routine healthcare database (CPRD) for this purpose. Other case study teams expressed regret at this limitation. For example, the Wave 1 telithromycin case study team noted that in their application of PSM, "criteria are assumed to be independent of each other. It is not clear how much the correlations affect the results." None of the case studies had access to patient-level data from clinical trials, but where such data are available, it may be helpful in revealing and adjusting for any correlations that could affect the results.
Several case studies (telithromycin, natalizumab, rosiglitazone) noted that the Bayesian statistical framework is particularly well suited to deriving probability distributions for benefit and risk outcomes.
Indirect/Mixed Treatment Comparison (ITC/MTC)
ITC/MTC was found to be a valuable tool for bringing together evidence on different comparators. For example, the Wave 2 rimonabant case study report states that ITC/MTC was ""extremely useful in estimating the relative response between comparators when direct comparisons are not available."
The Wave 2 rimonabant case study team also noted that the biostatistical assumptions underlying ITC/MTC may not always hold in practice, saying "results were generated under an assumption that the common [pivot] option between different comparison pairs is identical. One would argue that is not always clinically plausible."
In the Wave 2 natalizumab case study, the use of ITC/MTC for the evidence base, and the resulting complex data network, led to complications in the application of PSM. Although distributions for the source parameters were easily defined, the parameters were combined in the ITC/MTC framework under the assumption that they were independent, which may have affected the estimated variability of the decision model parameters.
ITC/MTC is a useful tool when direct comparative data are insufficient or unavailable to support a benefit-risk decision. There are strong arguments to suggest that evidence from direct comparison studies are most credible, but the ITC/MTC technique could still provide a benefit-risk assessor with a more comprehensive picture by amalgamating direct and indirect evidence.
-
What are our recommendations regarding the use of visualisations when gathering evidence and preparing data?
What are our recommendations regarding the use of visualisations when gathering evidence and preparing data?
Three visualisation techniques were identified as being useful at this stage:- Structured and colour-coded tables of evidence data and sources
- Network graphs of the relationship of evidence data and sources
- Forest plots of the evidence summary
Data tables can be used to show an overview of numerical values of several measures for different treatments. When setting up a benefit-risk assessment problem, specialised data tables like the "Effects table" from the PrOACT-URL framework (Figure 1) and the "Source data table" from the BRAT framework (Figure 2[Insert links to these underlined words]) were generally found to be useful in the case studies. Such structured tables provide increased consistency and clarity to the decision problem. Good tables ease cognitive burdens of users and decrease the time required to extract the information.
The amount of information that can be included in a table increases as the benefit-risk analysis process progresses. Initially, tables may simply list the criteria (and perhaps the units of measure) without including any data values. The table can then be filled in and extended as required-typically, this process would begin with central estimates of the benefit and risk outcomes for each comparator, and perhaps go on to include measures of uncertainty, data sources, transformations, preference weights, or other information that may be required. When presenting a table for a specific purpose, however, it should be limited to only the relevant rows and columns (i.e., the options and criteria) to avoid adding cognitive burden when reading tables. Readability can be enhanced through the use of colour-coding to represent grouping and relationships.
Figure 1 PrOACT-URL 'effects table' listing the criteria for the benefit-risk assessment model in the Wave 1 efalizumab case study
Figure 2 BRAT 'source data table' listing the data for benefit-risk assessment model and their source in the Wave 1 natalizumab case study
When gathering data, it is recommended that the table be annotated or colour-coded to highlight any problems with the data, e.g., using a specific colour to indicate cells with missing data. The tree diagram and table produced initially may need to be revised in the light of data quality and availability, and this will serve as a useful visual summary of the issues.
It is also recommended that a version of the data table is prepared with full details of evidence sources, data transformations, and estimation techniques, enabling the data extraction process to be reproduced.
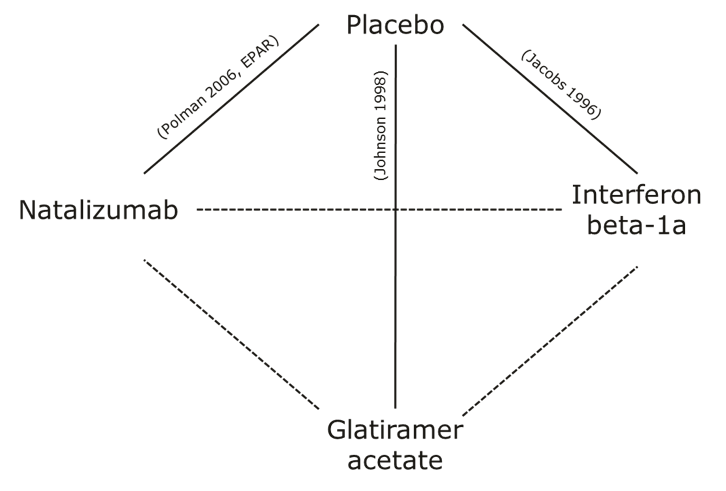
Another visual that may be useful at this stage is the network graph. The network graph can be used to give an overview of the sources of direct and indirect evidence on different treatment effects, which may drive the choice of benefit-risk assessment approach in the Analysis stage. The visual was not applied in any of the case studies because of trivial relationships between data sources. In particular, a network graph may be a useful visualisation in the application of ITC/MTC. For illustrative purpose, Figure 3 shows a network graph representing the direct and indirect evidence in the Wave 1 natalizumab case study (for more information, see Methodology Review (Mt-Isa et al., 2012): A.9.1 and A.9.4 and visual review: A.9 Network graph).
Figure3 Example of a network graph, based on the Wave 1 natalizumab case study. The solid lines represent direct evidence, and the broken lines represent indirect evidence. The texts next to each line refer to the literature reference.
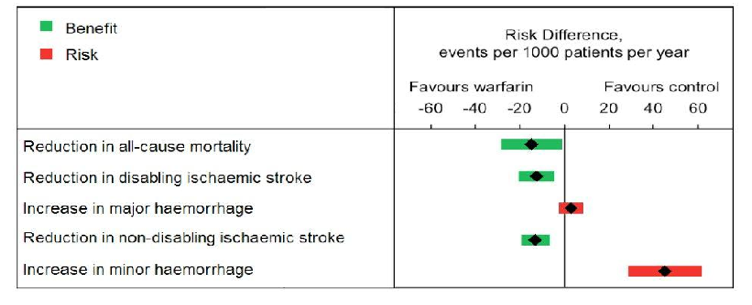
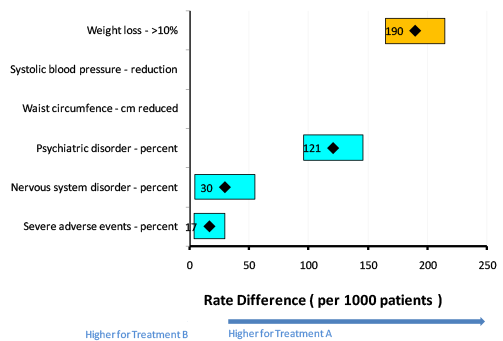
The forest plot or interval plot (Figure 4 and Figure 5, from the Wave 2 warfarin case study and Wave 1 rimonabant case study, respectively) can be used to communicate summary measures such as mean risk difference and risk ratios as well as their associated uncertainty (via confidence intervals). Forest/interval plots can be used as means of communicating benefit-risk data to specialist audiences such as physicians, regulators, and other experts. They may, however, be less intuitive for lay audiences to interpret.
Figure 4 Forest/interval plot for risk differences between warfarin and control (The number in the box is a point estimate and the width of the box is the confidence interval. Benefits are coloured green, and risks are coloured red.)
Figure 5 Forest/interval plot for risk differences between rimonabant (Treatment A) and placebo (Treatment B) (The number in the box is a point estimate and the width of the box is the confidence interval. Benefits are coloured yellow, and risks are coloured blue.) Figure 5 demonstrates a major limitation of forest/interval plots that was noted in the Wave 1 rimonabant case study: "The forest plot is most suitable when all outcomes can be measured in the same metric, e.g., percent." This is the reason why there is no data shown in Figure 5 for the two outcomes that were not expressed on the same scale as the others (i.e., Systolic blood pressure " reduction and Waist circumference " cm reduced).
Tables are easily produced in a variety of popular software packages. Forest plots can be produced easily in statistical software packages such as Stata, R, and SAS, and may be produced with a little more work in software such Microsoft Excel?? and Tableau. The BRAT tool produces both these visualisations.
Remarks
This section provides a systematic approach to gathering evidence and preparing data for a benefit-risk assessment. At the end of this stage, decision makers should have identified sufficient data for a first run of a benefit-risk model, aggregated them into suitable formats for analysis, and formed a clear idea of the types of analysis that are feasible given the data. Decision makers should also have finalised the criteria on the value tree to be used in the model. The initial model can be used to carry out "what-if" analyses, which will help to direct the search only to information that could affect the benefit-risk balance. The next section further discusses some of the benefit-risk assessment approaches available and provides some guidance on selecting appropriate ones that can deal with the data prepared
