Introduction
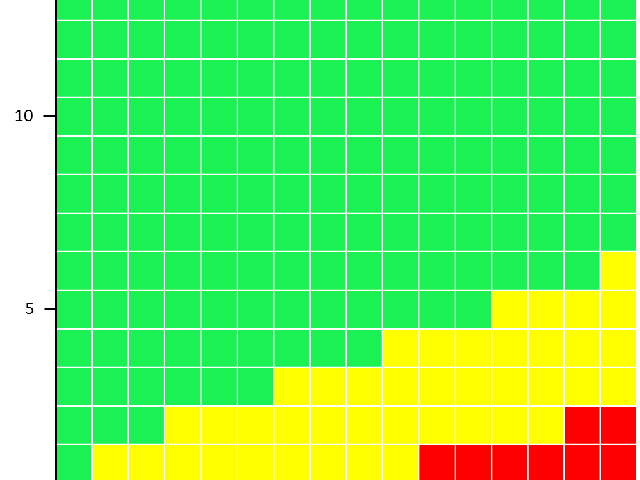
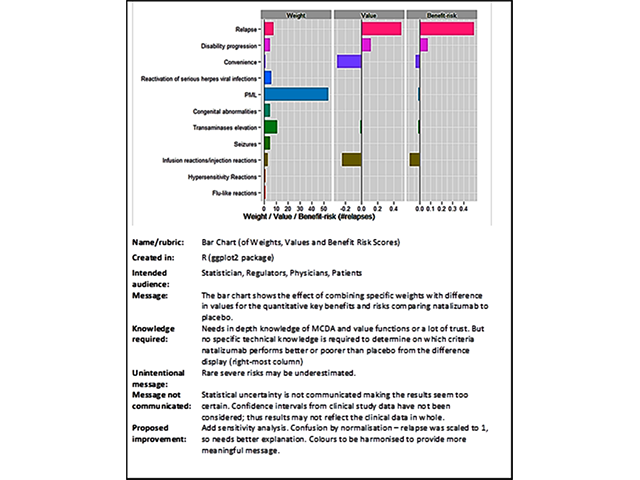
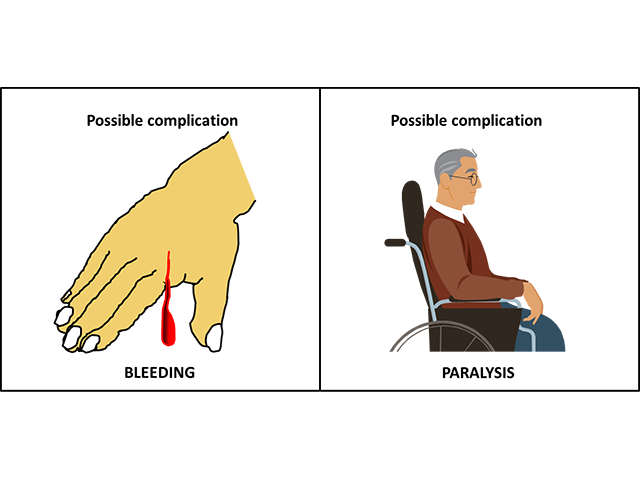
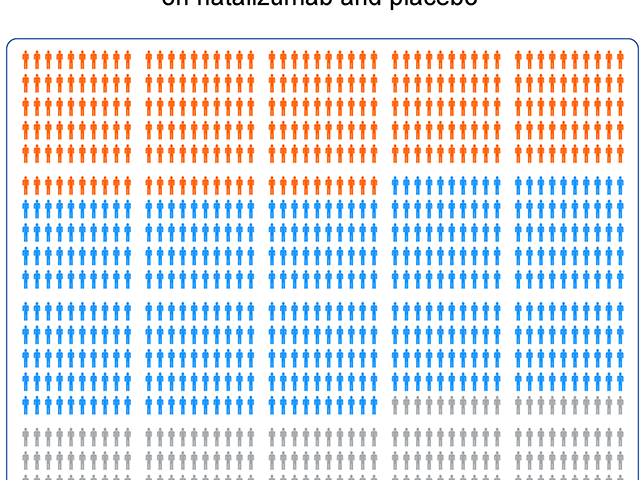
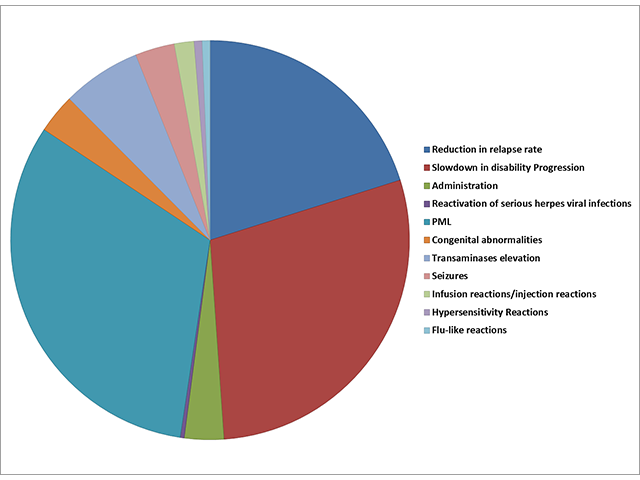
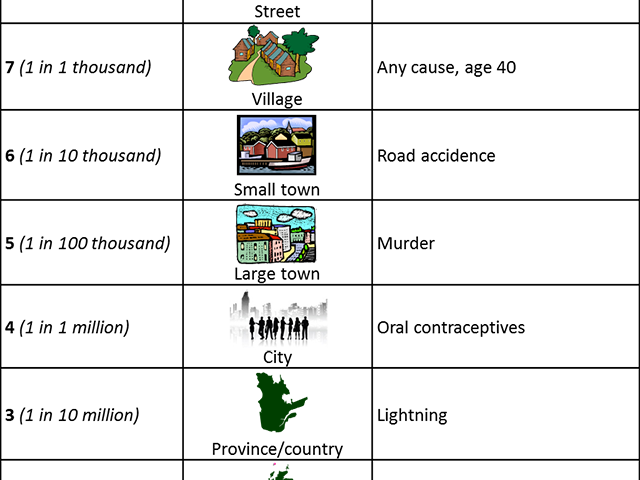
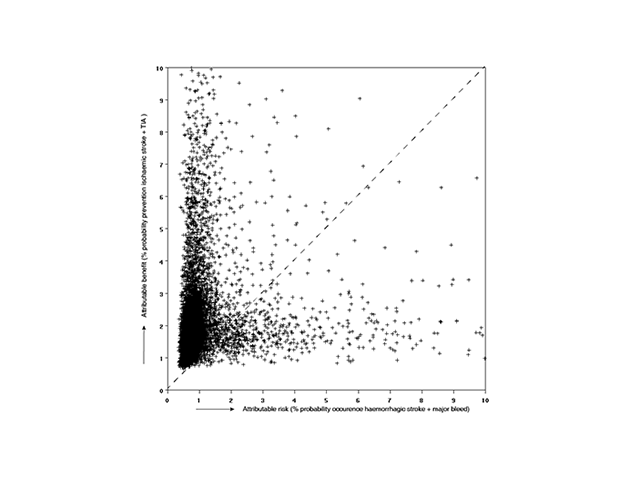
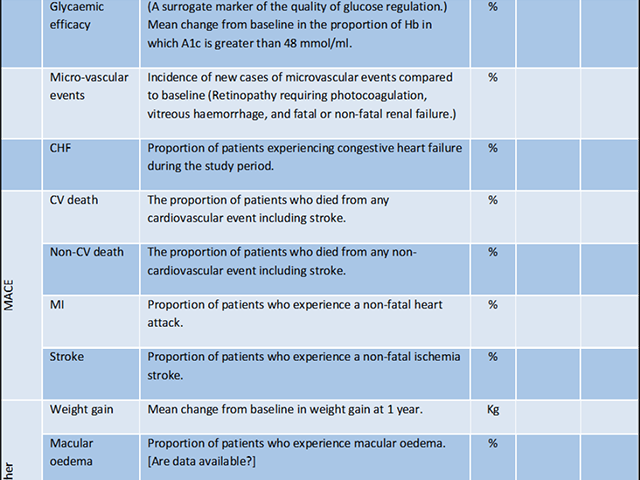
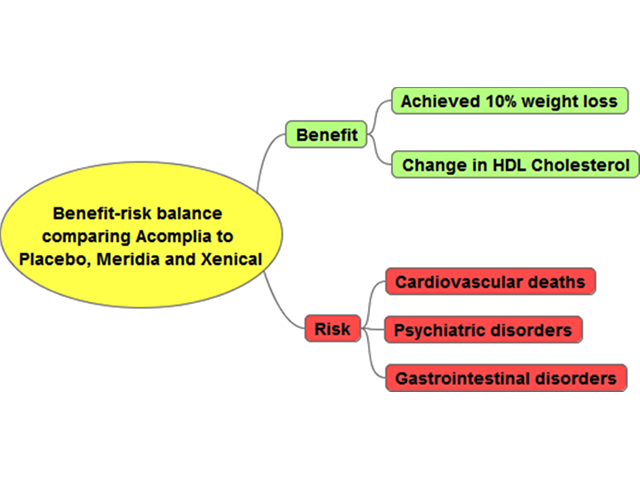
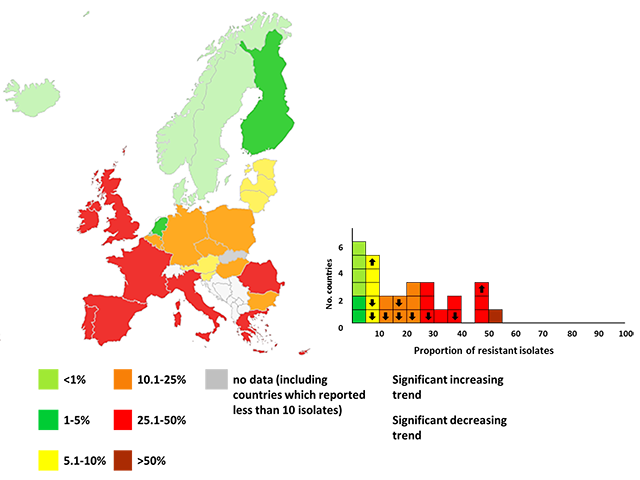
There are many ways in which benefits and risks are presented and communicated.
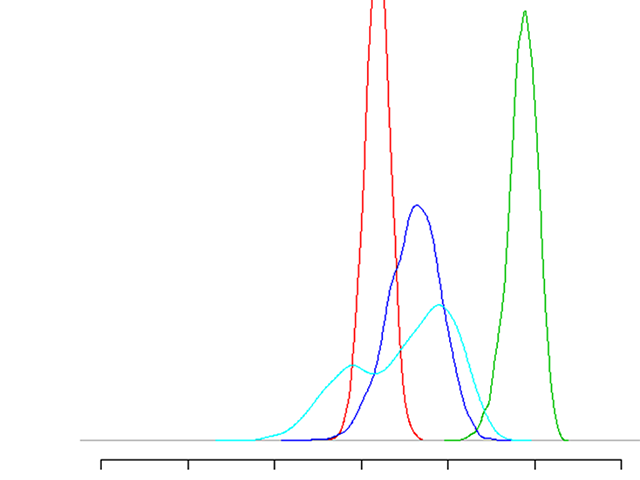
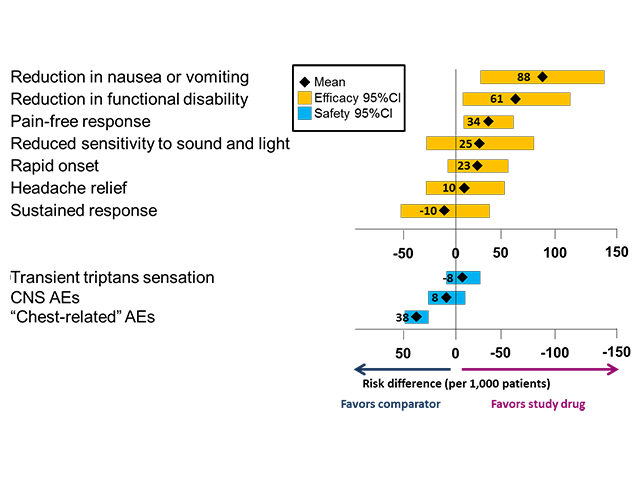
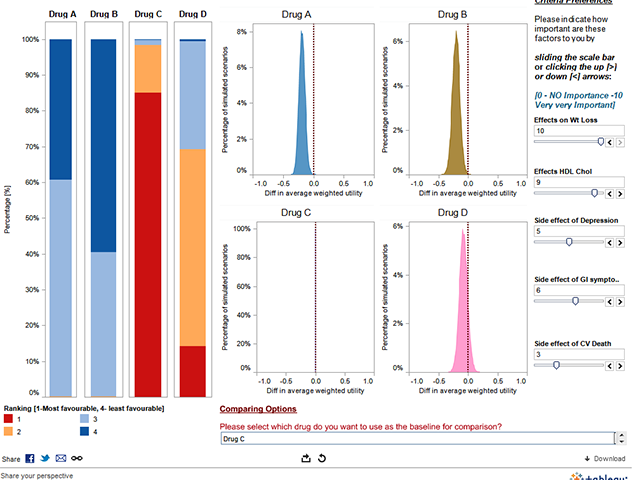
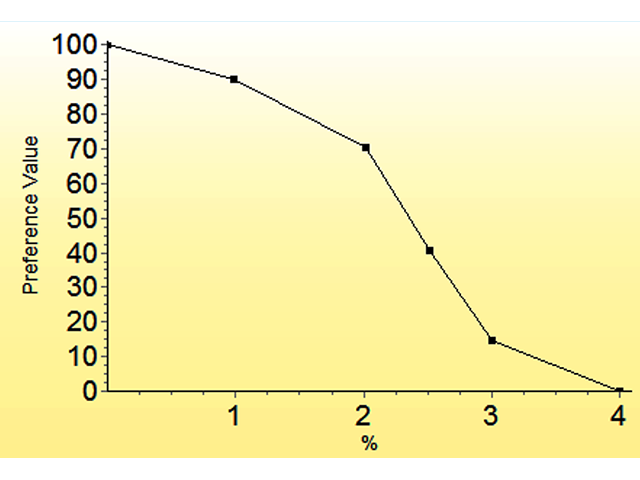
There is an absence of a consensus on which visual representations are most suitable to display benefit-risk profiles.
The visual representation of benefits and risks review has been conducted in two stages.
The first stage provided a level of evaluation as to the suitability of visuals presented in the application of benefit-risk approaches in PROTECT methodology review. However, external circumstances such as the intended audience, complexity of the benefit-risk problem, time in drug lifecycle, and other factors that are not related to the benefit-risk methodology may influence the type of visual representation to use. The second stage therefore explored and identified suitable visuals to communicate benefits and risks to different stakeholders in different situations. This included the use of visualisations in dynamic and interactive settings.

