
Section 3 Flow chart to illustrate BR score
Benefit-risk calculations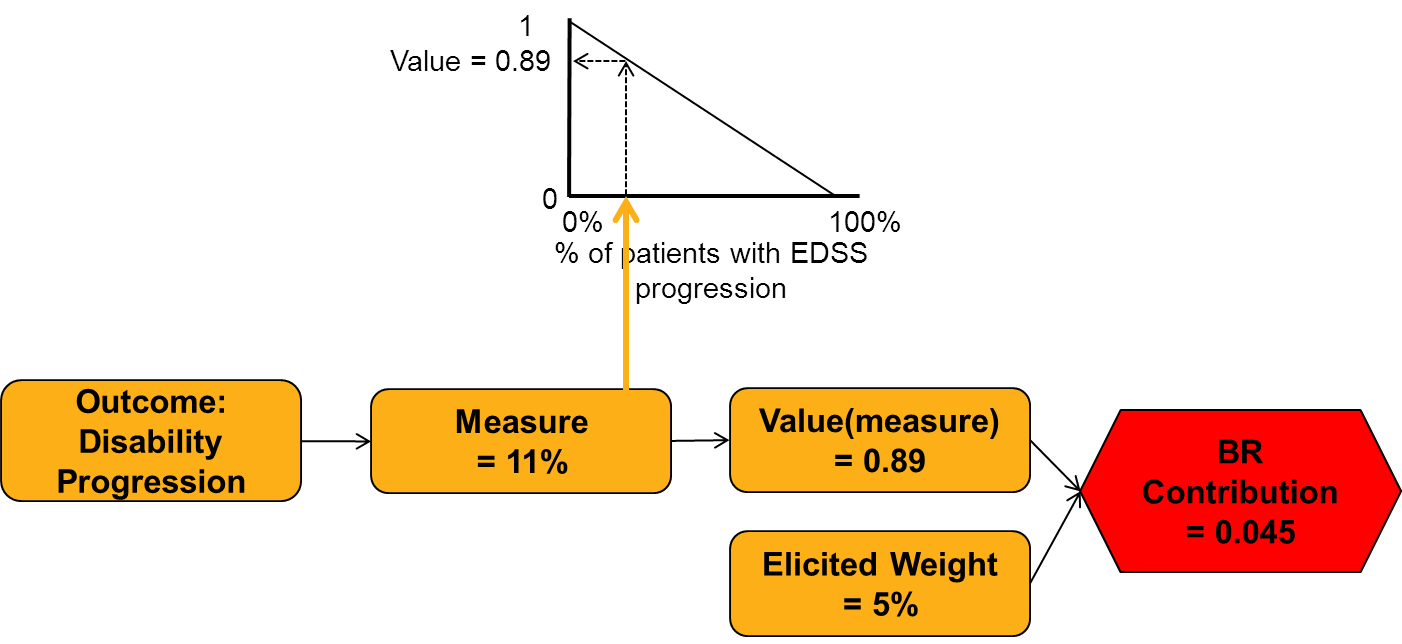
| Short name | Description |
|---|---|
| Name/rubric | Flow chart showing systematic review literature screening |
| Created in | MS Powerpoint |
| Message | To visualise the MCDA concept of scoring. The figure shows benefit risk contribution of one isolated parameter (Disability); relationship between value and parameter, modeled as a linear function |
| Intended audience | Statisticians, Regulators, not for Physicians or Patients |
| Knowledge required | In depth knowledge of MCDA and value functions. Knowledge of parameter/endpoint on the horizontal axis and the plausible values. |
| Unintentional message | Unclear. Also, there is no inclusion of sensitivity or uncertainty aspects of the value function. |
| Message not communicated | It is also beneficial to focus further on the likely range of the values on the horizontal axis? |
| Proposed improvement | Provide number of excluded articles and brief reasons for exclusion at each screening stageIt might help some users understand the concept better if similar figures are produced for all key parameters. The figure would benefit from annotations explaining more clearly why a linear function was chosen. The terminologies used are unfamiliar to many users, therefore would require more explanations e.g. the difference between value and weight, and why MCDA requires them. |