
Section 14 Bar chart aligned with difference display
Aligned bar chart of utility values by treatment and their difference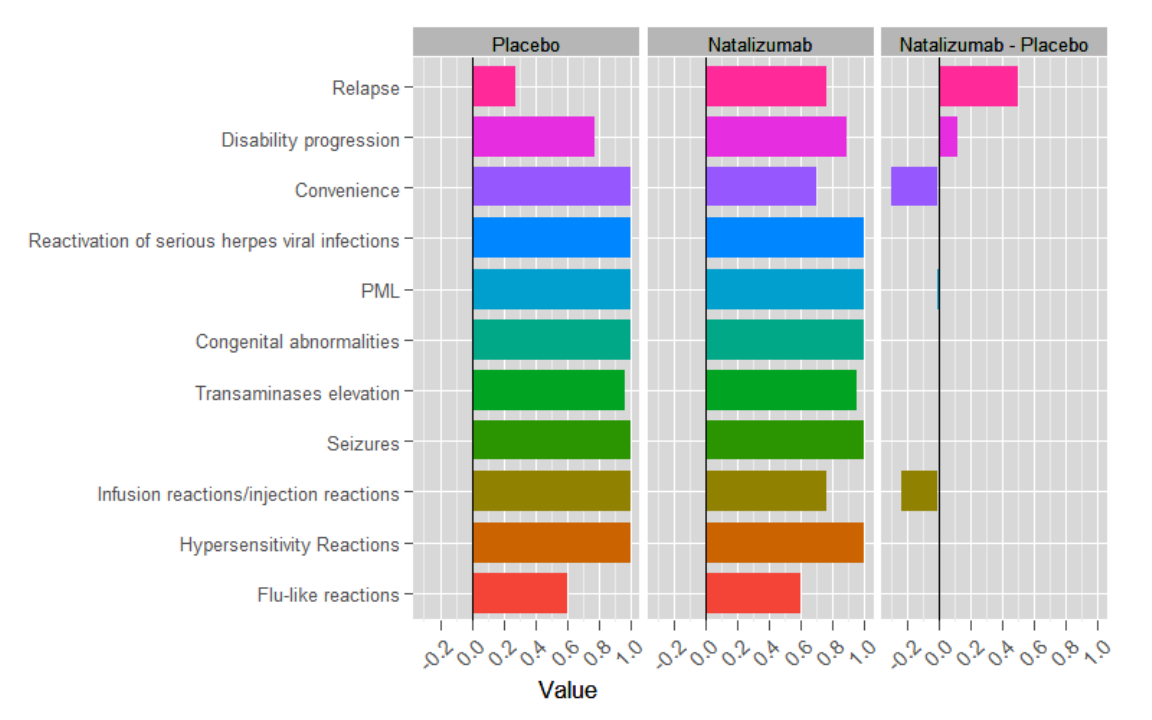
| Short name | Description |
|---|---|
| Name/rubric | Aligned bar chart with difference display |
| Created in | R (ggplot2 package). |
| Message | The bar chart shows the quantitative key benefits and risks values by criterion and comparative treatments, and the difference between them. The meaning of the values is unclear. The lengths of the bars appear to be the same. |
| Intended audience | Statisticians, Regulators not for Physicians or patients |
| Knowledge required | Needs in depth knowledge of MCDA and value functions to understand the message properly. But no specific technical knowledge is required to determine on which criteria natalizumab is valued higher or lower than placebo from the difference display (right-most column) |
| Unintentional message | There is a lack of transparency and gives an impression of complexity. There is very minimal benefit risk balance. The importance of PML may be underestimated from the value difference. |
| Message not communicated | More explanation on whose values and what do the values mean are needed. Statistical uncertainty is not described |
| Proposed improvement | Harmonise colours to give meaningful message. Add sensitivity analysis. The meaning of values and their difference need to be explained to aid interpretation. The horizontal axis on the difference display should be labelled with "Favours natalizumab" and "Favours Placebo" appropriately. |