
Section 5 BRAT master data summary table
Master data summary table (only partly-shown here)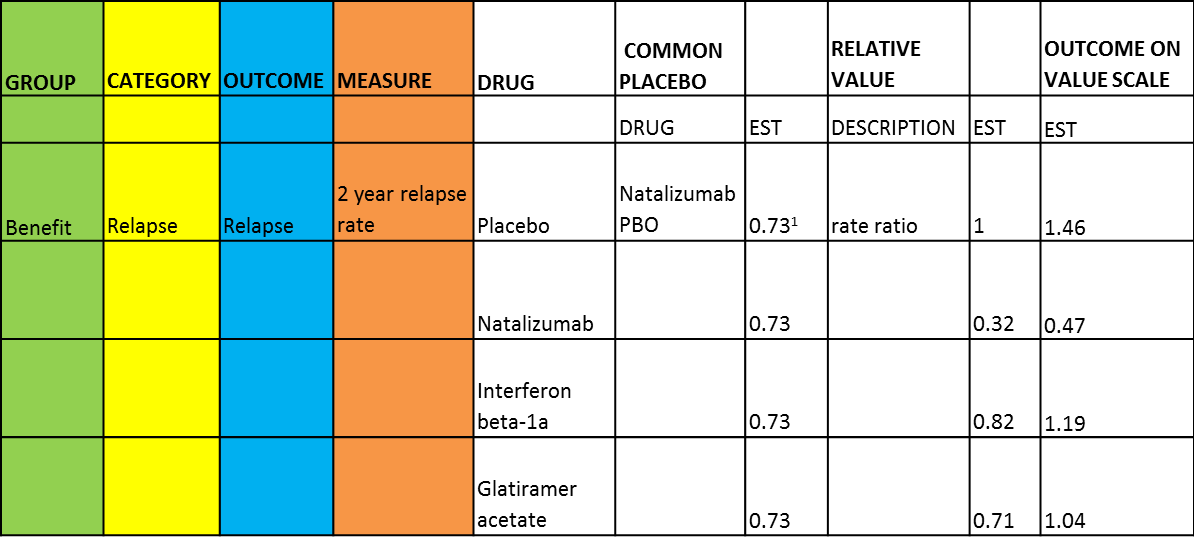
| Short name | Description |
|---|---|
| Name/rubric | Table as used in BRAT framework (only a part of full table is shown) |
| Created in | Microsoft Word (table facility) |
| Message | To lay out descriptive (or quantitative) information in a grid structure The figure shows a summary of the master data consisting of benefits and risks criteria used, the way they are measured, and their magnitudes from all studies for all drugs being compared. |
| Intended audience | Statistician, regulators and physicians. Not for patients. |
| Knowledge required | Some familiarity with the units of measurements and terminologies used – percentage (%), rate ratio, hazard ratio, value scale. Some medical knowledge on the outcomes and epidemiology of the drug-disease |
| Unintentional message | The table header labelling is confusing, particularly in the sixth column when it is labelled with ¡°Common Placebo¡± but listed natalizumab in subsequent rows in that column. The colour-coding and variation are meaningless since they only represent hierarchy of criteria which does not add value. |
| Message not communicated | NA. Note: This is part of a larger table with risks also defined. |
| Proposed improvement | Colour-coding should be done by row instead of column to be meaningful. Colour-coding by rows imply grouping of benefits and risks criteria therefore making the measurements more easily interpretable. |