
Section 16 Stacked bar chart
A stacked bar chart of incremental benefit-risk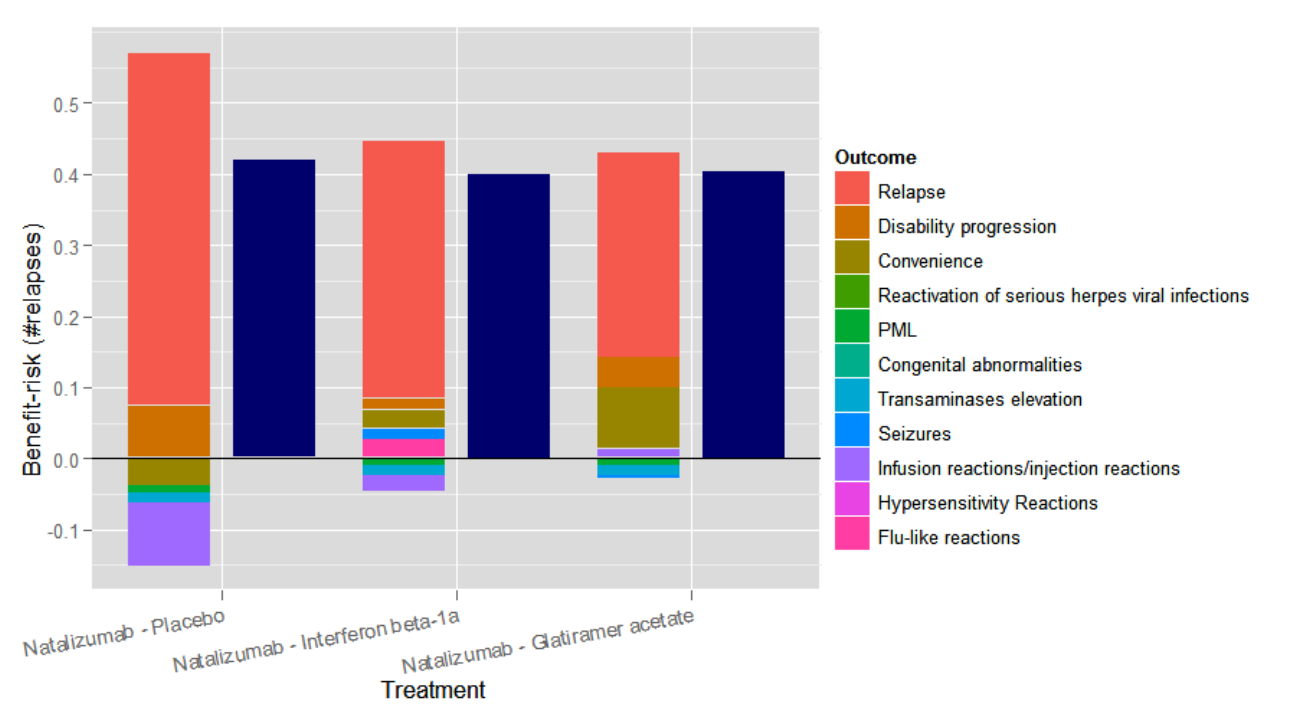
| Short name | Description |
|---|---|
| Name/rubric | Stacked bar chart (of incremental benefit risk) |
| Created in | R (ggplot2 package). |
| Message | The bar chart shows the incremental benefit-risk contribution by criterion for natalizumab compared to placebo, Beta-interferon and Glatiramer acetate. It displays the magnitude and direction of contributed criteria to the overall score. It also displays the magnitude and direction of the change in benefit values having discounted risk by criteria and treatment (dark blue bar). |
| Intended audience | All |
| Knowledge required | No specific technical knowledge is required. Some understanding of the incremental benefit-risk concept i.e. the knowledge that negative values equate to decreased benefit-risk balance, and positive values equate to increased benefit-risk balance. |
| Unintentional message | No uncertainty in the benefit-risk balance is presented. |
| Message not communicated | Very small scores may not be visible, giving the impression that natalizumab exactly equals comparator on the criterion, which may lead to misinterpretation to users. The dark blue bars are not labelled, so the quantity as to what is presented is unknown. |
| Proposed improvement | Dark blue bars to be labelled. |