
Section 18 Tornado plot
Tornado plot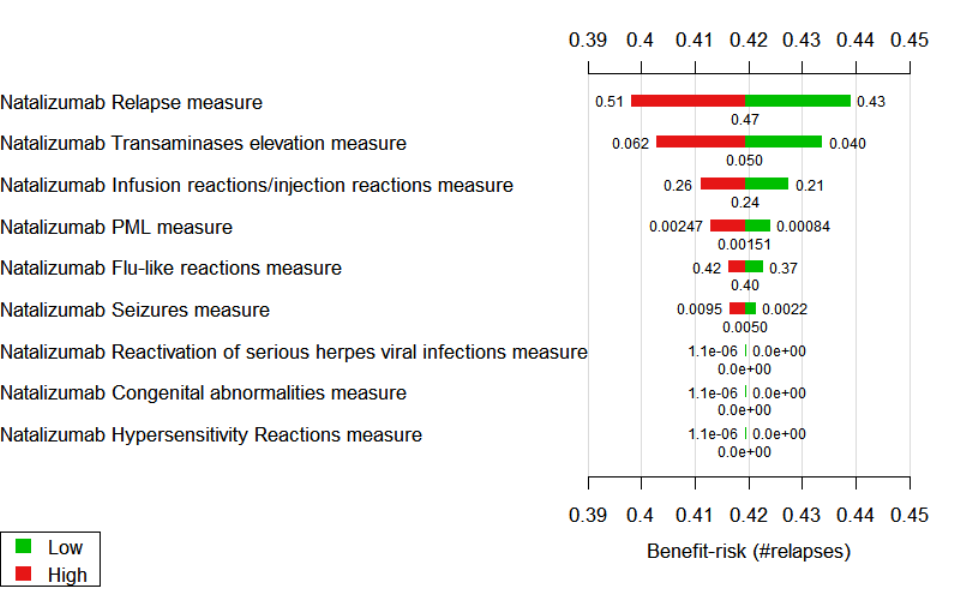
| Short name | Description |
|---|---|
| Name/rubric | Tornado plot |
| Created in | R . |
| Message | The tornado plot shows how the changes in the natalizumab outcome measure affect the incremental benefit-risk score. It displays the relative importance of criteria via one-way sensitivity analysis of changing a fixed amount of the measured outcomes. |
| Intended audience | Statisticians and regulators. Not for physicians and patients. |
| Knowledge required | Some knowledge on the use of sensitivity analysis and uncertainty. Some understanding of the incremental benefit-risk concept. Some knowledge on how to extract information from tornado diagrams.. |
| Unintentional message | The legend of "high-low" is not intuitive and could be misleading.. |
| Message not communicated | It is unclear which of the criteria are benefits and which are risks. The colour-coding is not intuitive and difficult to interpret. |
| Proposed improvement | Horizontal axis should be made wider to accommodate benefit-risk values. To re-label legend items to more intuitive terms. The tornado plot could also be accompanied by text annotations to aid interpretation. |