
Section 9 Line graph of two-way sensitivity analysis
Two-way sensitivity analysis plotValue function used for convenience (administration route)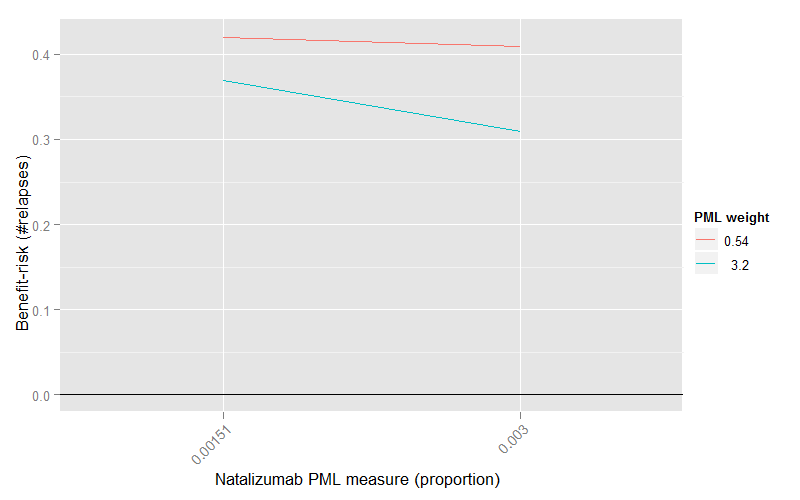
| Short name | Description |
|---|---|
| Name/rubric | Two-way sensitivity analysis plot. |
| Created in | R |
| Message | To show how the changes in both the number of patients developing PML and the weight associated with PML affect the benefit-risk score. It shows the sensitivity of benefit-risk balance, for values of a variable (here % of patients with PML) for different weights of that parameter. |
| Intended audience | Statisticians and regulators. |
| Knowledge required | Need to understanding of concept of weights, as well as know the probabilities of PML events. Users also need to know that negative BR values represent poorer outcomes. |
| Unintentional message | Low PML weight might be interpreted as lower preference to experiencing PML.. |
| Message not communicated | The choice of particular weight values is unclear from the graph. There is also no mention that the lines only represent benefit-risk scores against plausible proportions of patients who may experience PML with treatment |
| Proposed improvement | The graph could be somewhat confusing to someone with a lack of background knowledge on the problem at hand; perhaps more explanation in the way of a title or annotation is required. Explanation of weights choice is also required. More distinct colours should be used to discriminate the effects of different weights. |