
Section 6 BRAT key benefit-risk summary table
Natalizumab versus Placebo (Comparator) at time of CHMP re-evaluation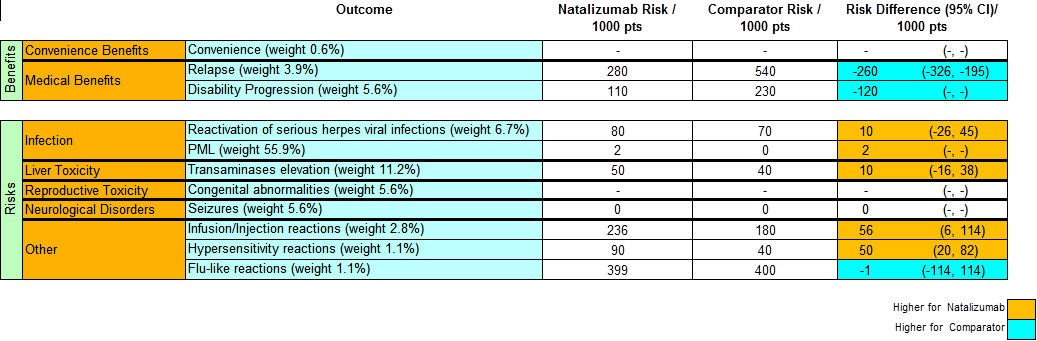
| Short name | Description |
|---|---|
| Name/rubric | Key benefit risk summary table as used in BRAT framework |
| Created in | BRAT Excel Tool table with edit in Microsoft PowerPoint |
| Message | To lay out descriptive (or quantitative) information in a grid structure. The figure shows quantitative key benefits and risk with comparison to alternative treatments. The absolute numbers on the table are supportive to allow better judgements. |
| Intended audience | Physicians and regulators. Not for patients |
| Knowledge required | Low statistical knowledge and some medical knowledge of the outcomes |
| Unintentional message | Risks have higher weights than benefits from the number of criteria used in the model. The legend is misleading when the colours in the last column are coded as ¡®Higher for natalizumab¡¯ instead of coding in terms of ¡®Favors natalizumab¡¯, and likewise for Comparator. |
| Message not communicated | NA. Note: This is part of a larger table with risks also defined.The criteria weights are displayed in the table but the role of the weights is not clear. It is unclear whether the results presented have taken into account weights or whether the weights should be considered separately. This in turns could make deciding on the benefit risk balance much more critical. |
| Proposed improvement | Comparison to other comparators than placebo may also help in the decision-making. A table can be more complex than a graph. The use of blue and yellow scheme should be replaced with the traditional green and red scheme. If weights are to be presented, the ordering should reflect the weights. Weights should be removed or incorporated into the incidences and other calculations since presenting individual weights is not self-explanatory. Labelling of placebo should be explicit as ¡°Placebo¡± instead of ¡°Comparator¡±. There should also be a text note to emphasise that data come from clinical trials. |