
Section 15 Bar chart aligning weight, values and benefit-risk scoreh3>
Aligned bar chart of the derivation of the difference in weighted values
| Short name | Description |
|---|---|
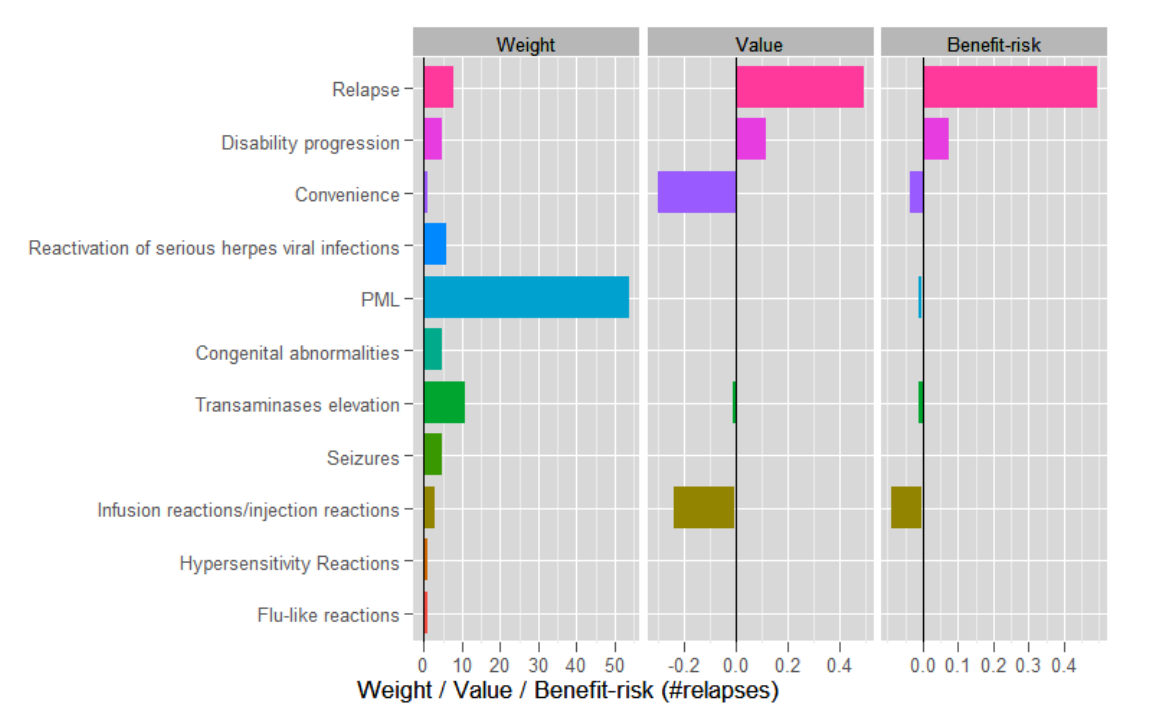
| Name/rubric | Bar Chart (of Weights, Values and Benefit Risk Scores) |
| Created in | R (ggplot2 package). |
| Message | The bar chart shows the effect of combining specific weights with difference in values for the quantitative key benefits and risks comparing natalizumab to placebo. |
| Intended audience | Statistician, Regulators, Physicians, Patients |
| Knowledge required | Needs in depth knowledge of MCDA and value functions or a lot of trust. But no specific technical knowledge is required to determine on which criteria natalizumab performs better or poorer than placebo from the difference display (right-most column) |
| Unintentional message | Rare severe risks may be underestimated. |
| Message not communicated | Statistical uncertainty is not communicated making the results seem too certain. Confidence intervals from clinical study data have not been considered; thus results may not reflect the clinical data in whole |
| Proposed improvement | Add sensitivity analysis. Confusion by normalisation – relapse was scaled to 1, so needs better explanation. Colours to be harmonised to provide more meaningful message. |