
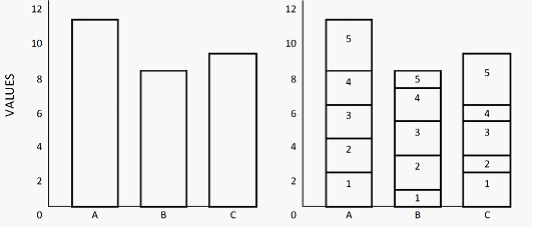
An example of a simple and a divided bar chart
Reproduced and modified from Cleveland WS, Mcgill R. Graphical perception and graphical methods for analyzing scientific data. Science 1985 Aug;229(4716):828-33.
A simple bar chart is shown on the left, where there is one single part information in each bar A, B and C. The bars can be divided into sections, representing more than one piece of information as shown in the bar chart on the right. Cleveland and McGill termed this as a divided bar chart [Cleveland and Mcgill 1985]. A divided bar chart (see also stacked bar) is a cleaner way to represent more than a piece of information on a bar chart, but there are consequences. For example, it is difficult to order the categories 1-5 in bar A (extracting information accurately), and it is also difficult to compare the same category (1-5) on different bars.