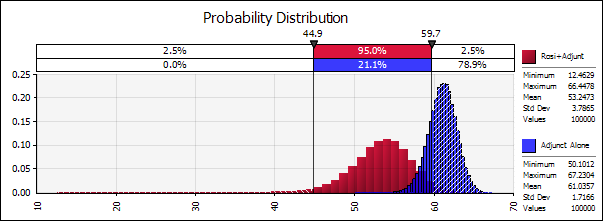
Cumulative probability for two treatment alternatives

The figure shows cumulative probability for two treatments in the Rosiglitazone Case Study. The complete probability distribution model was simulated for 100,000 iterations in @RISK. The red probability distribution, for rosiglitazone plus adjunct, has a wider and shorter bell shape compared to the shape for adjunct only. The probability distribution for rosiglitazone plus adjunct is also skewed to the left with a significant low minimum overall value of 12. In contrast, the probability distribution of adjunct only has a narrower and taller bell shape and is more symmetrical. There is also some overlap in the middle between the two probability distributions. At this stage of the analysis, confidently claiming superiority for rosiglitazone plus adjunct may not be fully justified. It is possible for rosiglitazone plus adjunct to score a higher overall value than adjunct only. This raises the important question of how likely this is.
