
Probability distribution for the value difference
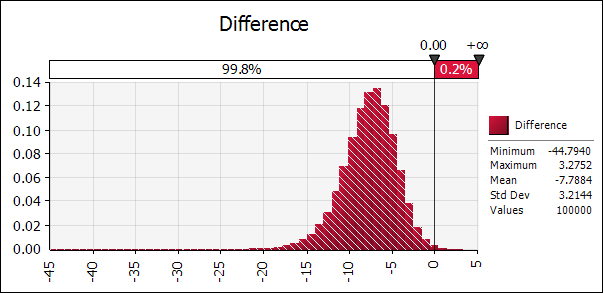
The figure shows 100,000 iterations of the difference between the overall score of rosiglitazone plus adjunct compared to adjunct only in the Rosiglitazone Case Study. The important result from this simulation is that our uncertainty about the possible superiority of rosiglitazone plus adjunct over adjunct alone can be represented by a single probability: the area of the probability density function shown above that is to the right of zero: it is 0.2%. In other words, based on the simulation runs and given the validity of assumptions regarding the additive value model, there is only a 0.2% chance that the benefit-risk balance of rosiglitazone plus adjunct is better than adjunct only. For all 100,000 runs of the simulation, rosiglitazone plus adjunct showed a better overall benefit-risk than adjunct only just 200 times. The reason for this extreme result is to be found in the very low probability that a simulation run will choose a value in the right tail of the rosiglitazone plus adjunct distribution and in the same run a value in the left tail of adjunct only because both are very low probability possibilities.