
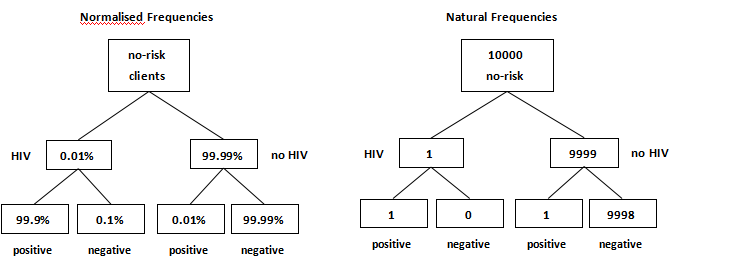
A value tree with frequencies
Reproduced from Kurz-Milcke, E., Gigerenzer, G., & Martignon, L. 2008. Transparency in risk communication: graphical and analog tools. Ann N Y Acad Sci, 1128, 18-28.
Tree diagrams can be used to display data such as conditional probabilities or frequencies at each node, or sometimes on the branches.The value trees above show relative frequencies (on the left), and natural frequencies (on the right) of HIV testing on each node. The value trees above did not use arrows, but only line connectors, to indicate the direction and hierarchy. However, the tiered structure of a value tree already implies hierarchies.