
A colour-coded value tree
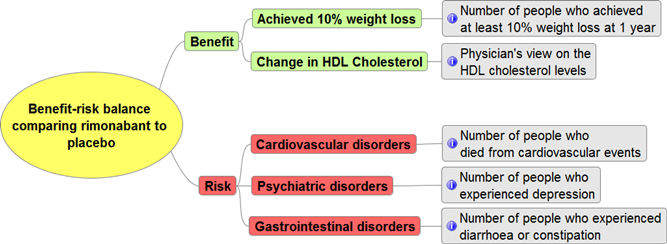
The value tree above shows the benefit and risk criteria that were used in the Rimonabant Case Study. Benefit criteria were colour-coded as green, and the risk criteria were colour-coded as red. The benefit-risk balance was colour-coded in yellow. The value tree above also displays the definitions of each criterion in grey boxes. Although the colour-coding enhances the presentation, the application is redundant since the branches on the value tree already imply groupings. Intuitive terminologies chosen to be displayed on a value tree could also help with perception. The value tree above was created in FreeMind.