
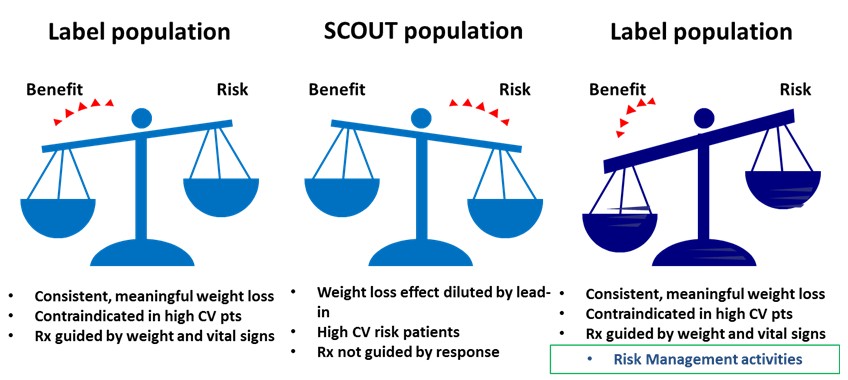
Scales to illustrate changes in benefit-risk balance
(The figure was reproduced from:
link
In benefit-risk assessment of medicines, cartoons or (scale symbols) like above can be used to show the benefit-risk balance in different populations or under different scenarios. The figure above was used in a sponsor slide at a FDA advisory committee meeting. The scales on the left and in the middle were used to illustrate the difference in benefit-risk balance between two populations. The scale on the right illustrates the effect of changing benefit-risk balance in the "Label population" by introducing risk management activities. The users need to recognise the symbol is a balancing scale and should know that the more substantial (heavier) side would appear lower, and that horizontal arms indicate equal balance.