
Stochastic Multi-criteria Acceptability Analysis (SMAA)
In the Rimonabant Wave 1 case study report, we investigated the feasibility of using the SMAA methodin benefit-risk assessment of drugs and the added values there might be associated with this method in comparison with MCDA. The team found that the ability to incorporate statistical uncertainty in the data into SMAA models is a very welcoming feature (see also MCDA (Stochastic) in the Natalizumab Case Study). Additionally, SMAA allows different forms of weighting types.
We constructed SMAA models based on the results from the indirect treatment comparison (ITC)analysis, and the criteria in the value tree in Figure 1 below. Here, we demonstrate how different weighting types (missing, range, rank and specific) can be incorporated into SMAA, and their effects on the final results. Table 1specifies the four different weighting types or scenarios that we investigated in this case study.
More comprehensive results are available in the Rimonabant Wave 2 case study report.
Figure 1 Value tree for SMAA model in the rimonabant case study
Table 1 Scenario of different types of weights in SMAA
| Missing weights | We assumed there was no prior information available regarding the preferences on benefit and risk criteria. The model then explored the possible weight combinations (uniformly between 0 and 1) across all criteria. |
|---|---|
| Range weights | We assumed that the exact weights on the benefit and risk criteria were unknown. However, we had some idea of the range of what these weights might be. The model then explored the possible weight combinations based on the specified ranges, assuming a uniform distribution, across all criteria. |
| Rank weights | We assumed that the exact weights on the benefit and risk criteria were unknown. However, we had some information on the order of preference (ordinal) on the criteria. The model then explored the possible weight combinations (uniformly between 0 and 1) with specified order as constraints. |
| Specific/elicited weights | We know the weights on each criterion in the model based on preference elicitation exercise that we conducted in the case study. Therefore, the weights that represented the stakeholders’ preference on the criteria were fixed in the model. Stakeholders could be anyone including patients, public, physicians, payers, regulators and the benefit-risk assessors, or a combination of them. |
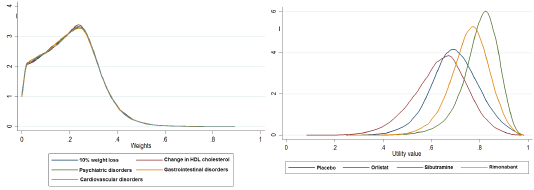
Table 2below shows the weights that we used in the four scenarios. We run simulations (100,000 iterations) from randomly sampled weights based on the specified constraints. The weights were then multiplied by the distributions of the data (utility values) to calculate the weighted utility distributions of each alternative treatment for weight loss.The left panels in Figure 2– Figure 5 show the distributions of these weights by criterion, and the right panels show weighted utility distributions of each alternative. Using these final weighted utility values, we ranked the alternatives first, second, third and fourth at each iteration.The higher weighted utility values were ranked higher.
Table 2 Weight assumptions under three different scenarios
| Criterion | Missing weight 0 – not important 1 – very important |
Weight range 0 – not important 1 – very important |
Ranking 1 – most important 5 – least important |
Weight 0 – not important 1 – most important |
|---|---|---|---|---|
| Achieving 10% weight loss | 0.0 – 1.0 | 0.5 – 1 | 1 | 0.8 |
| Change in HDL Cholesterol | 0.0 – 1.0 | 0.2 – 0.5 | 2 | 0.4 |
| Psychiatric disorders | 0.0 – 1.0 | 0.3 - 0.7 | 3 | 0.5 |
| Cardiovascular disorders | 0.0 – 1.0 | 0.1 – 0.4 | 4 | 0.2 |
| Gastrointestinal disorders | 0.0 – 1.0 | 0 – 0.4 | 5 | 0.6 |
Figure 2 Weights under the missing weight scenario (left) and weighted utilities by alternative (right)
Figure 3 Weights under the range weight scenario (left) and weighted utilities by alternative (right)
Figure 4 Weights under the rank weight scenario (left) and weighted utilities by alternative (right)
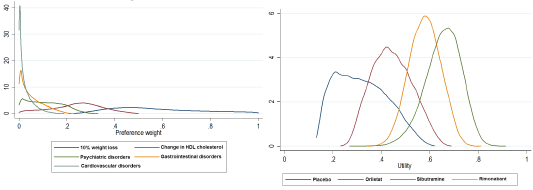
Figure 5 Weights under the specific/elicited weight scenario (left) and weighted utilities by alternative (right)
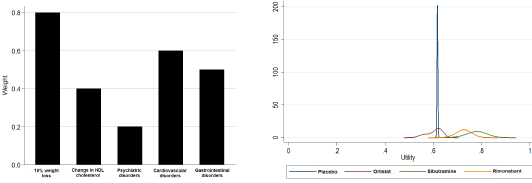
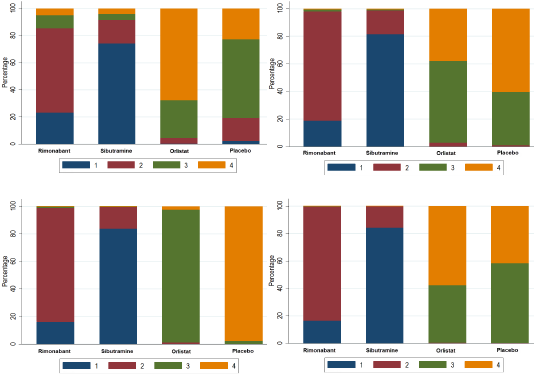
Finally, we calculated the percentage of times each rank was assigned to the alternatives. Figure 6shows the ranking percentages in all four scenarios – the higher probability an alternative take on a lower rank, the more preferred that alternative would be, under the current model assumptions and data.
Figure 6 Percentage of times (in the simulation) that an alternative ranked 1, 2, 3 and 4 in the missing weight scenario (top left), the range weight scenario (top right), the rank or ordinal weight scenario (bottom left), and the specific or elicited weight scenario (bottom right)
In all four weight scenarios, the SMAA models consistently found that sibutramine was the most preferred alternative – 74% of the times in the missing weight scenario, 82% of the times in the range and rank weights scenarios, and 83% in the specified weight scenario. These models suggested that rimonabant would be the next preferred alternative, followed by orlistat and placebo. The slight discrepancy of the rank percentages between the specified weight scenario (the most relevant to decision-makers and stakeholders) and the missing weight scenario demonstrate that elicited weights from the most relevant stakeholders to the decision problem at hand may alter the final decision, as well as other priorities. Although this discrepancy was immaterial in this case study, in other cases the choice of weights may play a bigger role.