
Number needed to treat and Number needed to harm
The number needed to treat (NNT) and number needed to harm (NNH)are typically related to the benefit and risk criteria, respectively. Both metrics are described here. However, a negative-valued NNT is equivalent to NNH, and vice versa. From the public health perspective, NNT and NNH were slightly redefined to take into account the baseline event rates most relevant to the population in question, and were termed as the Exposure Impact Number or EIN (see Impact Numbers and Heller (2002)).
Exposure impact number is simple to interpret, that is as the number of people in the population that have to be exposed to the intervention to observe one event. As NNT and NNH, EINis calculated as the inverse of the difference in the incidence of the event in the rimonabant and placebo groups. In Table 1, we show themedian and 95% confidence intervals of EIN for each criterion accounted for in the case study.For example, we expected to observe one person (event) who achieved a 10% weight loss among six people who received rimonabant, as the key driver for benefit in the model. This one observation could vary between four and nine people being exposed to rimonabant (95% confidence intervals). We also expected to observe one event of any anxiety after exposing 32 people to rimonabant.However, we might observe this one event in the first 17 people exposed to rimonabant, or after as many as 69 people having been exposed. A smaller NNT (EIN for a benefit criterion) than NNH (EIN for a risk criterion) demonstrates a favourable exposure to rimonabant (or an intervention) based strictly on the two criteria, ignoring other outcomes.
Table 1 EIN (or NNT for benefit or NNH for risk) by year: the number of people who received rimonabant among whom one excess case of the events described by the criteria was attributed to rimonabant
| Criterion | Median | 95% CI |
|---|---|---|
| 10% weight loss at 1 year | 5.97 | (4.34, 8.37) |
| Reduction in metabolic syndrome | 4.94 | (3.56, 7.21) |
| Diarrhoea | 64.68 | (22.19, 438.26) |
| Nausea | 14.22 | (9.20, 23.48) |
| Vomiting | 55.50 | (25.29, 186.33) |
| Asthenia/Fatigue | 85.55 | (-830.07, 1045.60) |
| Influenza | 71.37 | (-1664.83, 1718.06) |
| Gastroenteritis viral | 112.73 | (-1260.49, 1555.44) |
| Upper respiratory tract infections | 68.05 | (-1000.15, 1072.40) |
| Confusion | 63.55 | (22.58, 244.04) |
| Fall | 152.10 | (-1741.48, 2170.51) |
| Joint sprain | 106.80 | (-659.85, 1039.35) |
| Muscle cramps | 184.95 | (-2780.97, 3194.08) |
| Muscle spasms | 186.21 | (-1368.78, 2347.66) |
| Tendonitis | 89.52 | (31.79, 442.83) |
| Dizziness | 37.96 | (19.90, 107.26) |
| Hypoesthesia | 102.85 | (31.76, 588.36) |
| Memory loss | 133.85 | (-204.45, 1170.85) |
| Sciatica | 156.90 | (30.67, 1623.38) |
| Anxiety | 31.11 | (16.56, 68.44) |
| Depressive disorders | 63.84 | (27.18, 234.39) |
| Insomnia | 45.40 | (22.43, 136.11) |
| Irritability | 77.43 | (26.32, 338.80) |
| Mood alterations with depressive symptoms | 59.75 | (26.34, 258.57) |
| Nervousness | 96.57 | (18.29, 8.96e+06) |
| Parasomnia | 73.18 | (14.56, 198045.09) |
| Sleep disorder | 156.90 | (30.67, 1623.38) |
| All psychiatric disorders | 253.08 | (-1911.40, 8.47e+08) |
| Cardiac disorder | 304.70 | (-6320.05, 12529.14) |
| Death | -598.21 | (-9289.47, 14171.14) |
| Road traffic accident | 1255.09 | (-2559.81, 4.41e+06) |
| Severe depression | 1255.09 | (-2559.81, 4.41e+06) |
| Urinary disorder | 330.44 | (-5295.35, 4.38e+06) |
| Hyperhydrosis | 141.20 | (32.62, 1203.00) |
| Pruritus | 141.20 | (32.62, 1203.00) |
| Hot flushes | 81.50 | (28.04, 364.55) |
| Constipation | n/a | n/a |
| Erectile dysfunction | n/a | n/a |
| Suicidal ideation | n/a | n/a |
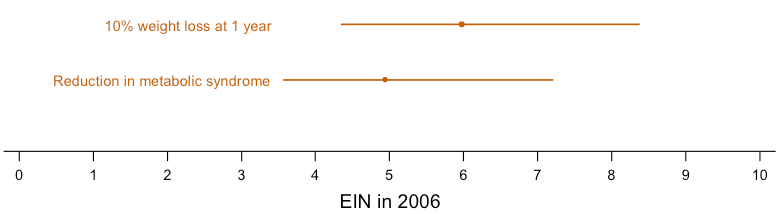
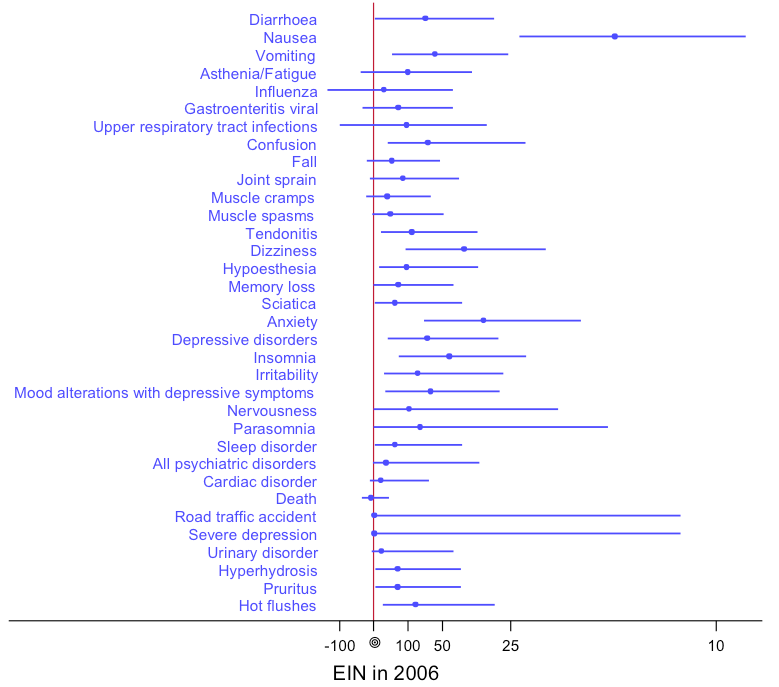
An ideal treatment would have very small NNT on all the benefit criteria, and very large NNH on the risk criteria. While NNT, NNH and EIN are easy to understand and make clinical sense, neither performs benefit-risk trade-off. Consequently, neither can be used to integrate multiple benefits and risks. Therefore, in Figure 1 and Figure 2 below,we present the benefits and risks in the model respectively as forest plots. The more to the left the estimates are, the more favourable the outcomes are for rimonabant compared to placebo.Figure 2 also demonstrates the situations when the confidence intervals for NNH (or EIN for risks) are not statistically significant. To visualise the confidence intervals clearly, we used the Altman’s resolution to invert the axis with the point of infinity (?) is placed in the middle (Altman, 1998).
Figure 1 Exposure impact numbers (EIN) and 95% confidence intervals for benefits (equivalent to NNT) in 2006
Figure 2 Exposure impact numbers (EIN) and 95% confidence intervals for risks (equivalent to NNH) in 2006