
BRAT Framework
In this part of the rimonabant case study, we, (a) assessed the feasibility and suitability of the BRAT framework for benefit-risk assessment of drugs by the regulator, having considered other stakeholders’ perspectives, and (b) evaluated the benefit-risk balance of rimonabant 20mg versus placebo at the time of marketing authorisation approval using the BRAT model.
Step 1: Define the decision context
In Table 1 we summarised the key information regarding the context of the decision problem. The most important decision for us was the choice to use the regulatory perspective. Plausible alternatives could have been the perspectives from patients, payers, the company or from physicians given the scope and resource limitations of this case study.
Table 1 The decision context
| Indication | Overweight |
|---|---|
| Drug | Rimonabant |
| Dosage | 20mg |
| Comparator | Placebo |
| Population | Body-mass index (BMI) greater than or equal to 30 kg/m2, or a BMI of 27.0–29.9 kg/m2 with one or more major obesity-related comorbidities. |
| Time horizon for outcomes | One year |
| Stakeholder perspective | Regulatory |
Step 2: Identify outcomes
We decided to include all outcomes from the EPAR. A value tree based on all outcomes becomes rather extensive. We built a value tree with the software FreeMind and present it below in Figure 1.
Figure 1Value tree for possible risks and benefits (using the FreeMind software)
Since we decided to use the outcomes listed in EPAR, this step became rather straightforward. Otherwise it could be tricky to decide which outcomes to include in this step. However, in this step it is better to include too many rather than too few outcomes.
Step 3: Identify and extract source data
In step3, we selected the data sources and outcome measures.We decided to mainly use the EPARdata. We also used additional data published in the literature to supplement the EPAR. The EPAR data is primarily based on the four RIO-studies. Table 2summarises the four trials.
Table 2Summary of the four RIO-studies (table extracted from Christensen R, Kristensen PK, Bartels EM, Bliddal H, Astrup A. Efficacy and safety of the weight-loss drug rimonabant: a meta-analysis of randomised trials. Lancet. 2007 Nov 17;370(9600):1706-13.)
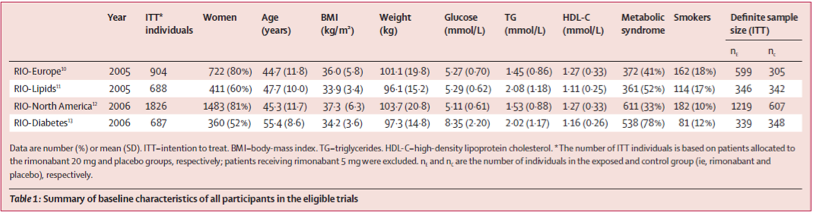
All relevant data were compiled in an Excel file for analysis. The data from the RIO-studies that were analysed and summarised by Christensen et al (2007) and the FDA saved us a lot of time in gathering and preparing data for analysis.
Step 4: Customize framework
In this step we 'fine-tuned' the value tree and selected which outcomes to use. Wealso decided which measures to use for each outcome. This task was accomplished through a telephone conference among case study team members. Even though we had no experience with the BRAT framework,we rapidly were able to immerse ourselves in the discussion in a useful way.
Step 4(a-i):Reduction of the benefits in the value tree
We reduced the number of benefit outcomes to as (partly) shown inTable 3.The majority of the participants in the telephone conference voted for keeping all the outcomes in the 'keep' column. However, for illustrative purposes we'll only use the three outcomes marked with an A in the 'keep' column.
Table 3 Benefits criteria evaluated at the telephone conference
| Level 2 criteria | Level 3 criteria | Keep | Exclude | Comment |
|---|---|---|---|---|
| Weight loss at 1 year | X (A) | Key readout | ||
| Cholesterol changes | Total cholesterol | X | ||
| HDL cholesterol | X | Nice to have | ||
| LDL cholesterol | X (B) | Key readout for CV-risk assessment | ||
| HDL/LDL cholesterol ratio | X | |||
| Triglyceride control | X (C) | |||
| Waist circumference | X (A) | |||
| Diabetes control | Fasting glucose | X | Nice to have | |
| Fasting insulin | X | Emerging CV-risk factor | ||
| Insulin resistance | X | Nice to have. Expected to improve if HbA1c lowering seen. | ||
| HbA1c | X | Key readout. Relevant for diabetics. | ||
| Blood pressure | Systolic control | X (A) | Key readout for CV-risk assessment | |
| Diastolic control | X (C) | Key readout for CV-risk assessment | ||
| Metabolic syndrome | X | Several definitions |
Step 4(a-ii): Selection of measures for the chosen benefits
Weight loss:Here we had the choice between weight reduction in kilogramsand the proportion of patients with a reduction greater than 10% (responders). To use responders was more convenient but it was not using as much information as the actual weight reduction. However, we chose the proportion responders/non-responders for convenience and illustrative purposes.
Waist circumference:For this variable the only measure wasthe average reduction in centimetres.
Systolic blood pressure: For this outcome the only measure was the average change in mmHg.
Step 4(b-i): Reduction of the risks in the value tree
The table with risk outcomes and the selection is given in Table 4. As with the benefit outcomes, it was very difficult to exclude any risk outcomes. For illustrative purposes we focus on three level 2 outcomes: psychiatric disorders, nervous system disorders and serious adverse events. However, we felt thatrisk outcomes at level 2 were not sufficient for a reasonable benefit-risk assessment because the information at level 2 is too coarse to really be informative. An increased risk for e.g. psychiatric disorder can have very different implications if it’s 'irritability' or 'depressive disorder'.
Table 4 Risks criteria to be evaluated
| Level 2 criteria | Level 3 criteria | Keep | Exclude | Comment |
|---|---|---|---|---|
| Infection and infestation | Upper respiratory tract infection | X | ||
| Gastroenteritis viral | X | |||
| Psychiatric disorder | Anxiety | X | Signal and need to evaluate CNS safety based on experience from CNS acting weight loss drugs | |
| Insomnia | X | Signal and need to evaluate CNS safety based on experience from CNS acting weight loss drugs | ||
| Mood alternation with depressive symptoms | X | Signal and need to evaluate CNS safety based on experience from CNS acting weight loss drugs | ||
| Depressive disorders | X | Signal and need to evaluate CNS safety based on experience from CNS acting weight loss drugs. (same comment for all CNS related AEs below | ||
| Irritability | X | |||
| Parasomnia | X | |||
| Nervousness | X | |||
| Sleep disorders | X | |||
| Nervous system disorders | Dizziness | X | ||
| Memory loss | X | |||
| Hypoesthesia | X | |||
| Sciatica | X | |||
| Vascular disorders | Hot flushes | |||
| Gastrointestinal disorders | Nausea | X | Common issue with weight loss drugs | |
| Diarrhoea | X | |||
| Vomiting | X | |||
| Skin and Subcutaneous Tissue disorder | Pruritus | X | ||
| Hyperhydrosis | X | |||
| Musculoskeletal and connective tissue disorder | Tendonitis | X | ||
| Muscle cramp | X | |||
| Muscle spasms | X | |||
| General disorder | Influenza | X | ||
| Asthenia/Fatigue | X | |||
| Injury, Poisoning and Procedural complications | Joint sprain | X | ||
| Contusion | X | |||
| Fall | X | |||
| Serious Adverse Events | Death | X | ||
| Overall Psychiatric disorder | X | |||
| Severe Depressive disorder | X | |||
| Cardiac disorder | X | |||
| Urinary disorder | X | |||
| Road traffic accident | X |
Step 4(c): Summary of the outcomes used for further analysis
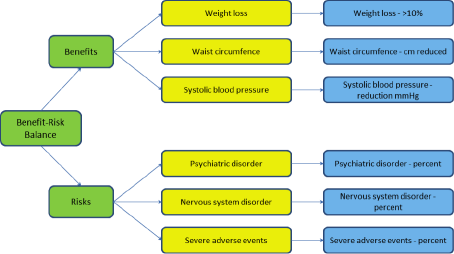
In Figure 2, we presented a reduced value tree for this model. We compromised on the reduced value tree for this case study as an illustration of the applicability of BRAT framework and due to limited time available.
Figure 2 A reduced value tree
In a real application of BRAT in benefit-risk assessment, there would be a need for much better documentation regarding all decisions made about the choices to include or exclude all outcomes. We found that 1.5 hour telephone conference to discuss these issues was not sufficient to be able to get a full discussion and a complete documentation. We suggest this step must be given much more time.
Step 5: Assess outcome importance
To be able to assess the importance of different outcomes they have to be studied in more detail. This is especially when we chose to present the risks at level 2. The importance of a psychiatric adverse event is of course dependent on the type of event and the severity of the event. Since this step is not a prerequisite for the BRAT method we decided to not assess any ranking of the outcomes chosen. However, an assessment of outcome importance was partly done when we trimmed the value tree in step 4.
Step 6: Display & interpret key B-R metrics
In the final step the results are displayed to give the decision-maker a good overview of the results. There are two main modes of presentation in BRAT: the summary table and the forest plot. We summarised the main results in a colour-coded Table 5according to benefit or risk outcomes.
Table 5 The estimated treatment effect for different outcomes (95% confidence intervals)
| Outcome | Rimonabant | Placebo | Difference | |
|---|---|---|---|---|
| Benefits | Weight loss (kg) a | -6.3 kg | -1.6 kg | 4.7 kg (4.1-5.3) |
| Weight loss >10% a | 25.5% (23.8 , 27.3) | 6.6% (5.5 , 7.9) | 19% (17 , 22) OR=5.1 (3.6 – 7.3) | |
| Waist circumference changes (cm) b | -6.2 (-7.2 , -5.2)) | -1.9 (-2.3 , -1.4)) | -4.3 (-5.5 , -3.0) | |
| Systolic blood pressure b | -1.3 (-2.0 , -0.5) | 0.5 (-0.6 , 1.6) | -1.8 (-2.8 , -0.8) | |
| Risks | Psychiatric adverse event c | 26.2% (24.5 , 28.0) | 14.1% (12.4 , 15.9) | 12.1% (10 , 15) OR=1.9 (1.5 , 2.3) |
| Neurological Adverse Event c | 27.4% (25.7 , 29.2) | 24.4% (22.3 , 26.6) | 3.0% (0.5 , 5.5) OR=1.7 (1.1 , 2.7)* | |
| Serious adverse event a | 5.9% (5.0 , 6.9) | 4.2% (3.3, 5.3) | 1.7% (0.4 , 3.0) OR=1.43 (1.03 , 1.98) | |
| a Christensen (2007) b Chan Edmond simulations c FDA Briefing document * The proportion of subjects with an adverse event (27.4 and 24.4% respectively) is not compatible with an odds ratio of 1.7. | ||||
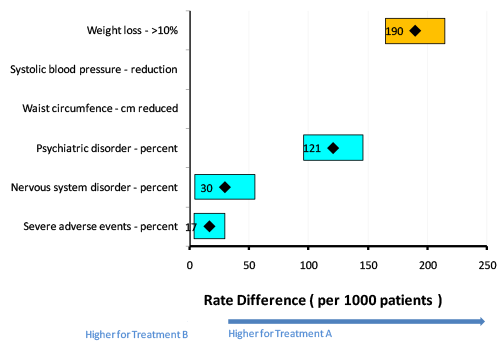
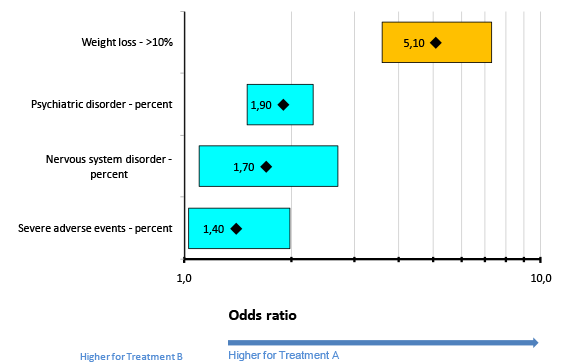
The other important display within the BRAT-framework is the forest plot. The two options available in the BRAT-software are to present the results as risk differences or relative risks (or odds ratios). However, two of our outcomes were measured in centimetres and mmHg, and could not be naturally presented as either risk differences or relative risks. Therefore, in Figure 3 there is no output for these two outcomes. We exclude these two outcomes from Figure 4. This could be seen as a key limitation of the current BRAT software (The next version of the software intends to address the issue of \"change from baseline\" measurements, such as we have here with centimeters and mmHg). In both Figure 3 and Figure 4, the orange rectangles represent confidence intervals for benefits and blue boxes confidence intervals for risks.
Figure 3Forest plot for risk differences between rimonabant (treatment A) and placebo (treatment B) (The number in the box is a point estimate and the width of the box is the confidence interval. Yellow is Benefit, blue is Risk)
Figure 4Forest plot for odds ratios between rimonabant (treatment A) and placebo (treatment B). (The number in the box is a point estimate and the width of the box is the confidence interval. Yellow is Benefit, blue is Risk)