
An example of the "key benefit-risk summary" table
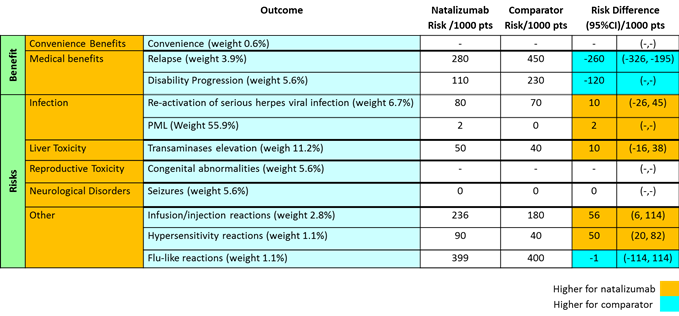
The 'key benefit-risk summary' table (KBRS) from the BRAT frameworkin the Natalizumab Wave 1 Case Studyprovides an overview of the benefit-risk balance by criterion. The KBRS shows rates of events for each treatment option, and either the difference or the ratio of the events rates. The readability is enhanced through the use of colour-coding to represent grouping, relationships and interpretation. Users can quickly see which option (here, natalizumab versus a comparator) has higher event rates on each criterion from the colour-coded last two columns (and legend) corresponding to the difference of events rates.