
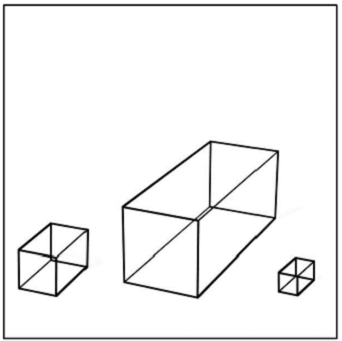
An example of a volume chart
Reproduced from Cleveland WS, Mcgill R. Graphical Perception - Theory, Experimentation, and Application to the Development of Graphical Methods. Journal of the American Statistical Association 1984;79(387):531-54.
Area and volume charts may also be presented without meaningful axes. In any case, users need to understand what the area or volume is presenting, and how are they calculated. Although it could convey whether differences exist between different areas or different volumes, it is difficult to clearly determine how much the differences are.