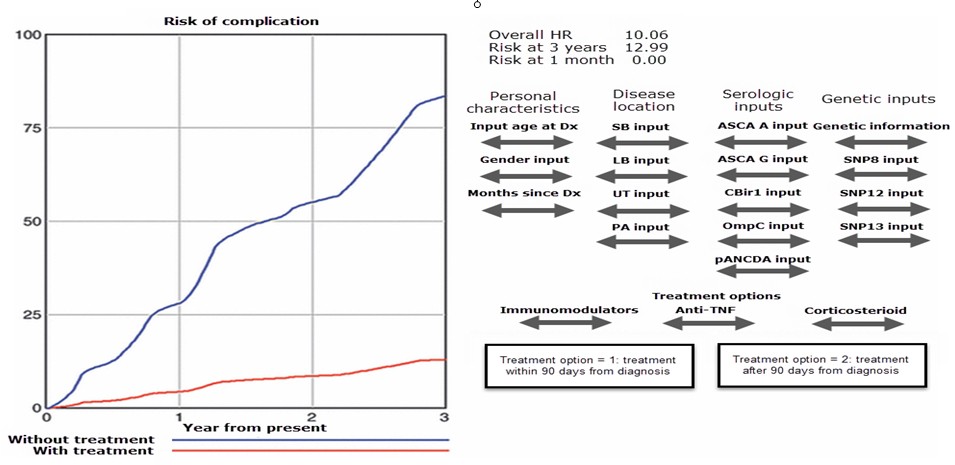
An example of an interactive line graph

Reproduced from Siegel, C.A. 2011. Review article: Explaining risks of inflammatory bowel disease therapy to patients. Alimentary Pharmacology and Therapeutics, 33, (1) 23-32.
The line graph shows the risk of complication with time with treatment and with no treatment, for individual patient characteristics. Here, the line graph has been designed interactively to show how the risk of complication varies over time when the characteristics of a patient are specified, by sliding the arrows on the visual display. A personalised risk of complications is then displayed on the line graph.
