
Probabilistic Simulation Method (PSM) using Benefit-Risk Ratio (BRR)
We used the probabilistic simulation method (PSM) to compare between 'Telithromycin' and 'Comparator' for the acute bacterial sinusitis (ABS) indication, with benefit and risk elements as those discussed in PrOACT-URL Framework and data obtained from pooled randomised controlled Phase III trials. We used other measures within the probabilistic simulations: benefit-risk ratio, number needed to treat and number needed to harm.
In this case study, we defined the Benefit-Risk Ratio (BRR) to be the ratio of the difference in benefit to difference in risk. More specifically, we used the ratio of Number Needed to Harm (NNH) to Number Needed to Treat (NNT):
where and are the probabilities of benefit in the telithromycin treatment and comparator arms, respectively, and and are the probabilities of risk. This represents the increase in expected number of patients who will benefit for each adverse event incurred from using telithromycin instead of comparator.
A probabilistic model was developed to incorporate uncertainty of both risks and benefits simultaneously by specifying probability distributions for each model parameter to represent their uncertainty. A Monte Carlo simulation (MCS) was run 5000 times to consider joint uncertainty of benefits and risks by randomly selecting values from each specified distribution. Two MCS methods were explored using SAS software (could also use R, SPLUS or Excel), both assuming risk and benefit vary independently. The first simulates the proportion of benefit and risk for each treatment arm using Beta distribution and incremental probabilities were calculated.[3] The second method simulates the difference of proportion using bivariate normal distribution.[4]
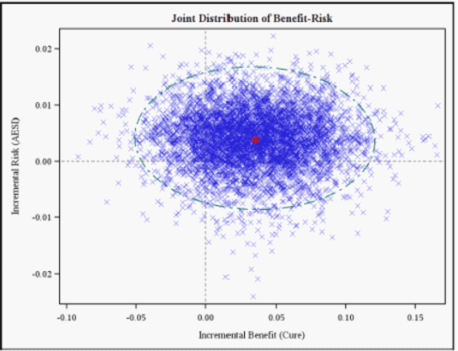
The incremental risk-benefit pairs from 5,000 simulations for ABS indications are presented on a risk-benefit plane or RBP (array and visualisation of simulated joint density of incremental risks and benefits) with ellipse 95% confidence interval to help assess uncertainty (Figure 17). Most points fell in the NE/SE quadrant, indicating a greater chance that telithromycin is more effective and with lower risk than the comparator for ABS indication.
Figure 17: Results of the Monte Carlo simulation for ABS indication plotted on the risk-benefit plane: the incremental probability of AESI (Hepatic, Syncope, Visual Cardiac) vs. the incremental probability of Cure, with 95% confidence interval. The red dot marks the point estimate of BRR of telithromycin vs. comparator. Because the benefit increases from left to right along the x-axis, positive values (to the right of the vertical axis) represent greater benefits with the telithromycin treatment. Similarly, positive Y-coordinates indicate a greater probability of the risk for the telithromycin treatment.
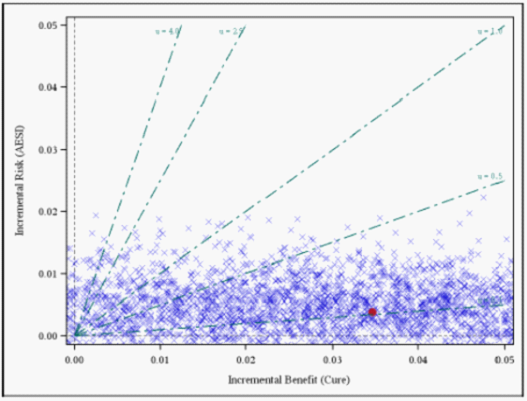
To accommodate different risk preferences, the results are also illustrated using the risk-benefit acceptability curve or RBAC (Figure 18), which incorporates different risk-benefit acceptability thresholds (μ), or the number of AESI's one is willing to accept per unit benefit (cure). At an acceptability threshold of μ = 0.25 one is willing to accept 1 AESI to avert four ABS and at μ=4, one would accept 4 AESI to avert 1 ABS. If one is willing to accept up to 1 SAE to avert 4 ABS (μ= 0.25), there is an 81% chance that telithromycin provides a net benefit.
Figure 18: Incremental risk (AESI: Hepatic, Cardiac, Syncope, Visual) versus incremental benefit (Cure) for ABS indication plotted on the RBP and varying acceptability threshold obtained by probabilistic simulation.
In Figure 19 below, there is also 96% chance that the risk-benefit ratio is less than 1 (i.e., 96% of the points fall below μ= 1). Correspondingly, there is a 4% probability that the number of AESI's induced by telithromycin is greater than the number of ABS's averted.
Figure 19: Risk-benefit acceptability curve for the probability that telithromycin is net-beneficial relative to comparator at any risk-benefit acceptability threshold. For example, if preferences were such that one is willing to accept 1 Hepatic event to gain cure rate by 1, the probability that telithromycin provides a net benefit is 0.96.
Comments on BRR using PSM
These methods (RBP, RBAC and PSM) are applicable to all decision problems in which BRR is calculated. They provide the necessary visualisation and representation of benefit-risk information and incorporate uncertainty. Simple models based on limited data may require only basic estimation techniques, but more complex techniques are required in health care, as treatment decisions are value- or preference-based and under uncertainty. Both the risk-benefit joint distribution plot and acceptability curves help the decision maker to trade-off risk and benefit. Potential problems in applying the techniques include collapsing benefits and risks into single measures (i.e. BRR). It is unclear how to incorporate multiple dimensions of risks and benefits into the two-dimensional RBP model. The approach is suitable for two therapies for a binary measure of benefit and a binary measure of risk.