
BRAT Framework
The PhRMA BRAT Framework is a set of principles, processes and tools to help decision-makers select, organise, understand and communicate evidence for pharmaceutical benefit-risk decisions. The BRAT Excel Tool developed by PhRMA BRAT was used to automate the charting and visualisation of numeric data related to two different treatments (e.g. telithromycin vs. placebo). Here, we summarised and demonstrate how the BRAT framework was used in this case study via the six-step approach.
1.Define the decision context
The benefit-risk assessment of telithromycin will be separated out into four separate assessment one for each of the indications Community acquired pneumonia (CAP), Acute exacerbation chronic bronchitis (AECB), Acute bacterial sinusitis (ABS), Tonsillitis/Pharyngitis (TP). The assessment will be done against a single alternative of grouped comparators of standard treatment antibiotics; this is done since all safety data are pooled in the EPAR. For each indication the comparator group consists of:
- CAP: Amoxicillin, Clarithromycin, Trovafloxacin.
- AECB: Amoxicillin-clavulanic acid, Cefuroxime, Clarithromycin, Azithromycin.
- ABS: amoxicillin-clavulanic acid, and cefuroxime.
- TP: Penicillin, clarithromycin
The decision questions are:
- Should telithromycin be given marketing approval at the time of first registration?
- Is FDA justified in removing the indications ABS (acute bacterial sinusitis) and AECB (acute exacerbation of chronic bronchitis) from the labelling in 2007?
2.Identify outcome
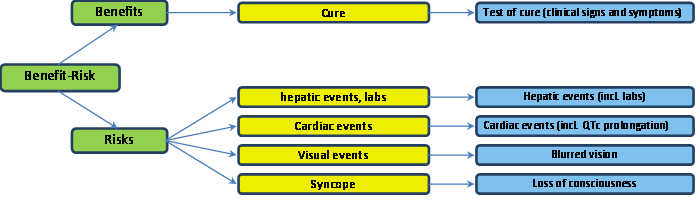
The same value tree was defined for each of the four assessments of telithromycin versus grouped comparators for treatment of ABS, CAP, AECB and TP, see figure 1.
Figure 1: Value tree for telithromycin versus grouped comparators for the treatment of ABS, CAP, AECB and TP
3.Identify data sources
Data from randomised. clinical trials (RCT) was extracted from the European Public Assessment Report, data source table can be found in Appendix-Data tables.
4.Customize framework
The value tree was not customized further for this analysis.
5.Assess outcome importance
Although weighting is possible within the BRAT framework, weight was not described explicit for this analysis (the current software tool does not include weighting).
6.Display and interpret key benefit and risk metric
We only present BRAT results for the AECB indication here, as an example. The results for other indications can be found in the Telithromycin Case Study Report.
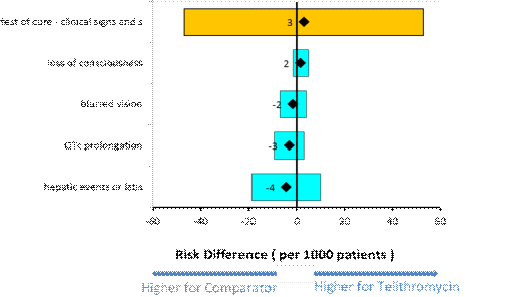
The key benefit-risk summary (KBRS) table (Table 1) and forest plot (Figure 2) for AECB show the risk differences (RD) and confidence intervals for the outcomes of interest. The benefit RD was calculated in a meta-analysis. The risk data were pooled. All of the confidence intervals include 0, suggesting there is no benefit and no reduced risk of telithromycin over the comparator for this indication.
Table 1: Key benefit-risk summary table for the assessment of telithromycin versus grouped comparators for the treatment of AECB
| Outcome | Telithromicin risk /1000 pts | Comparator risk /1000 pts | Risk Difference (95% CI) /1000 pts | Relative risk (95% CI) | ||||
|---|---|---|---|---|---|---|---|---|
| Benefit | Cure AECB | Test of cure (clinical signs) | - | - | 3 | (-47, 53) | - | (-,-) |
| Risk | Hepatic events (labs) | Hepatic events or (labs) | 15 | 19 | -4 | (-19, 10) | - | (-,-) |
| Cardiac events | Cardiac events incl. QTc prolongation | 2 | 5 | -3 | (-10, 3) | - | (-,-) | |
| Visual events | Blurred vision | 2 | 3 | -2 | (-7, 4) | - | (-,-) | |
| Syncope | Loss of consciousness | 2 | 0 | 2 | (-2, 5) | - | (-,-) | |
Figure 2: Forest plot of telithromycin versus grouped comparators for the treatment of AECB
Comments BRAT
Overall the BRAT framework has accomplished its purpose in displaying appropriate framing of the benefit-risk problem for each indication, and clearly displaying the risk differences for the outcomes of interest. Its displays can be sorted in order of priority, but there is no weighting function, which may in part account for the differences in results between SMAA and the BRAT.