
MCDA (Stochastic)
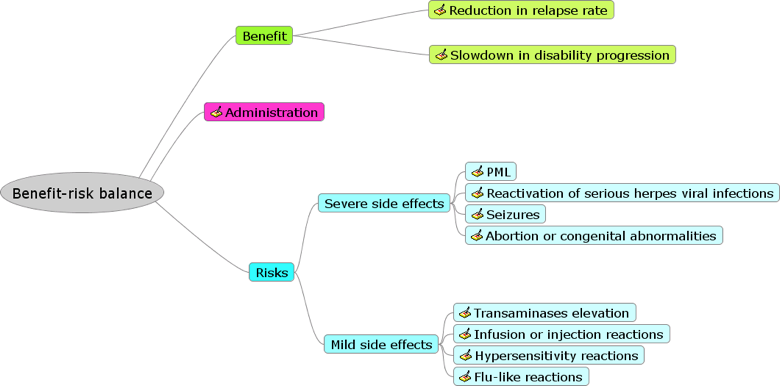
Stochastic analysis was carried out as part of the ‘Uncertainty’ step in PrOACT-URL framework, based on a revised value tree (Figure 13).
Figure 13 Revised value tree (Wave 2 case study)
There is no measure of uncertainty in deterministic MCDA based on point estimates so we cannot gauge the statistical significance of the difference in benefit-risk score, hence we cannot discount the possibility that any differences are simply due to chance. Results are presented from two models: “indirect model” (where rare outcomes are calibrated) and the "direct model" (where the absolute values of rare outcomes are used directly).
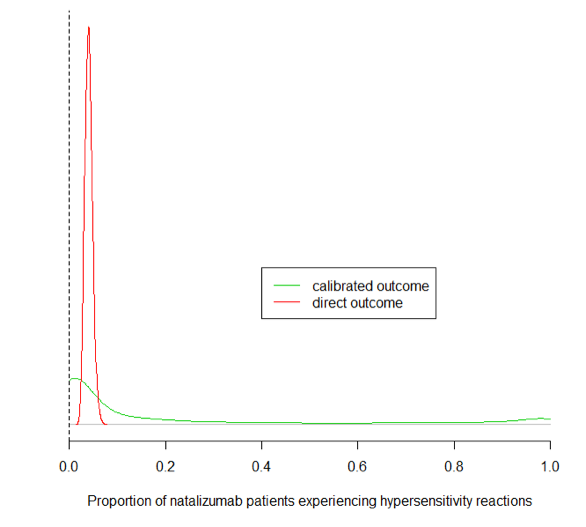
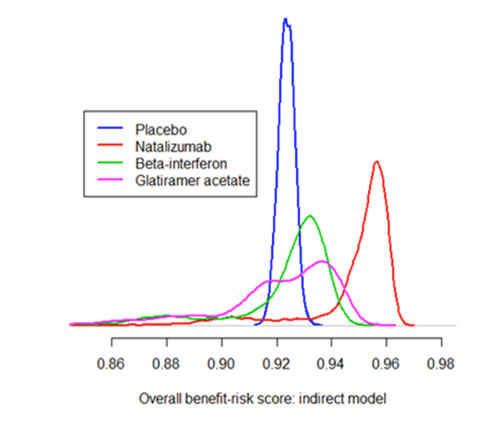
Figure 14 demonstrates the differences between the two models on the hypersensitivity reactions outcome. The distributions of the overall benefit-risk score for each treatment for indirect model is shown in Figure 15, and for direct model in Figure 16. Their counterparts represented as box-whisker diagrams are shown in Figure 17. It is only in the light of the stochastic analysis that the significance of natalizumab’s advantage over the other treatments becomes clear. The numerical results are given in Table 9. Relative to placebo, the distributions of the overall benefit-risk score for active treatments for indirect model is shown in Figure 18, and for direct model in Figure 19. Their counterparts represented as box-whisker diagrams are shown in Figure 20. The numerical results are given in Table 10. Three metrics are explored in communicating the results based on the stochastic analysis of MCDA, and are presented in Figure 21. It is also easier to infer from the distribution plots of overall benefit-risk that glatiramer acetate outperforms placebo, particularly in the direct model.
Figure 14 Model output: Distribution of hypersensitivity reactions in patients taking natalizumab. The vertical axis indicates probability density.
The calibrated outcome distributions for rare events, although centred around the maximum likelihood estimates as one would expect, seemed unexpectedly wide. The model without calibration of rare outcomes (which instead compares the absolute outcome in the treatment arms directly) results in a more familiar, vaguely bell-shaped distribution plot for these outcomes. As the distribution from the direct model is more precise and (arguably) appears more similar to a “typical” probability distribution, it is tempting to assume that this is the "correct" model for rare events. One should not be too hasty, however, in rejecting the calibrated model: one could argue that a long right tail is to some extent appropriate for rare events, as the paucity of observations means that estimates of the underlying rate are inherently uncertain.
Density plots of benefit-risk distributions
Figure 15 Overall benefit-risk distribution plot: direct model. The vertical axis indicates probability density
Figure 16 Overall benefit-risk distribution plot: indirect model. The vertical axis indicates probability density.
The long left tail corresponds to the long right tail of the calibrated rare outcome distributions.
Distributions represented by box-whisker plots
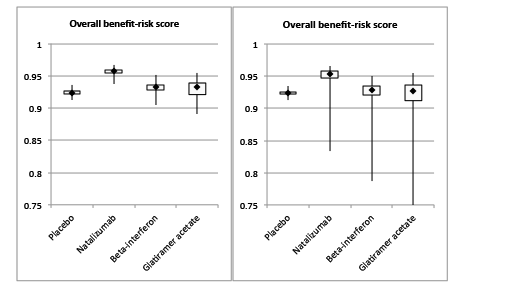
Figure 17 Overall benefit-risk box-whisker plot: direct model (left) and indirect model (right). The quantity on the vertical axis is the overall benefit-risk score, i.e. the overall utility of all 11 outcomes with the appropriate preference weights.
The “boxes” indicate the interquartile range of the distribution and the vertical “whiskers” extend to the minimum and maximum simulated values. The median of each distribution is indicated by a black diamond. From a visual inspection, it seems clear that natalizumab is the best treatment option. The bulk of the distribution lies to the right of or above the other treatments, corresponding to a higher overall benefit-risk balance. Choosing between the remaining three treatments is, however, not straightforward on the basis of these plots since the difference between medians is not great and there are also other aspects of the distributions to consider: for example, although placebo has a lower median benefit-risk than glatiramer acetate, the latter is more likely to have a benefit-risk score below a particular cut-off point (corresponding to overall utility of around 0.92).
Table 9 Medians and 95% credibility intervals for overall benefit-risk score.
| TREATMENT | OVERALL BENEFIT-RISK: MEDIAN (95% CI) | |
|---|---|---|
| Direct model | Indirect model | |
| Placebo | 0.924 (0.918, 0.929) | 0.924 (0.918, 0.929) |
| Natalizumab | 0.958 (0.950, 0.963) | 0.954 (0.897, 0.962) |
| Interferon beta-1a | 0.933 (0.920, 0.943) | 0.929 (0.869, 0.942) |
| Glatiramer acetate | 0.932 (0.907, 0.947) | 0.926 (0.864, 0.946) |
Density plots of benefit-risk distributions relative to placebo
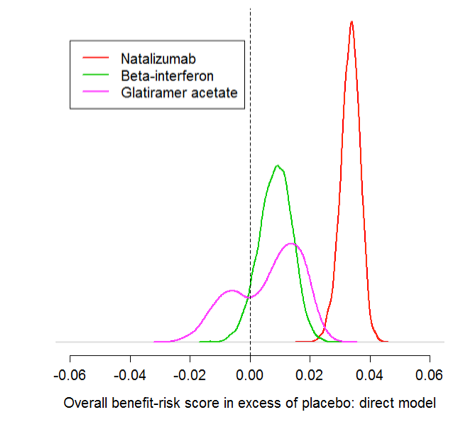
Figure 18 Overall benefit-risk relative to placebo, distribution plot: direct model. The vertical axis indicates probability density.
The dashed line indicates where benefit-risk is equal to placebo.
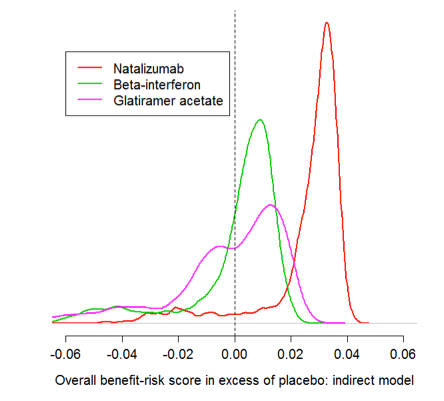
Figure 19 Overall benefit-risk relative to placebo, distribution plot: indirect model. The vertical axis indicates probability density
Box-whisker plots of benefit-risk distributions relative to placebo
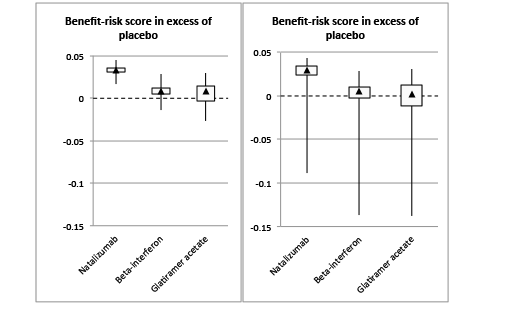
Figure 20 Overall benefit-risk relative to placebo, box-whisker plot: direct model (left) and indirect model (right). The quantity on the vertical axis is the overall benefit-risk score in excess of placebo
The medians and 95% credibility intervals of the benefit-risk distributions relative to placebo are shown in Table 10 below.
Table 10 Medians and 95% credibility intervals for overall benefit-risk score in excess of placebo.
| TREATMENT | BENEFIT-RISK IN EXCESS OF PLACEBO:MEDIAN (95% CI) | |
|---|---|---|
| Direct model | Indirect model | |
| Natalizumab | 0.034 (0.026, 0.039) | 0.030 (-0.027, 0.039) |
| Interferon beta-1a | 0.009 (-0.003, 0.019) | 0.005 (-0.054, 0.018) |
| Glatiramer acetate | 0.009 (-0.016, 0.023) | 0.002 (-0.060, 0.022) |
Metrics for comparing treatments
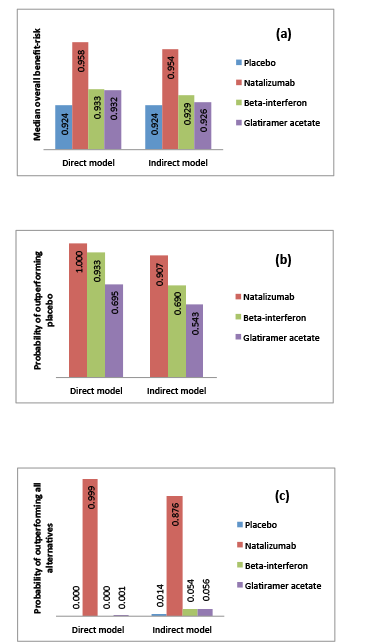
Figure 21 compares the treatments based on the following measures:
- (a)median overall benefit-risk score;
- (b)probability of outperforming placebo;
- (c)probability of outperforming all alternatives.
Figure 21 Comparison of treatments according to three different measures: (a) median overall benefit-risk score; (b) probability of outperforming placebo; (c) probability of outperforming all alternatives
Natalizumab is the optimal choice under all three metrics (and in both models). Placebo is consistently ranked as the worst alternative. Beta-interferon has only a very slight advantage over glatiramer acetate in terms of median benefit-risk (Figure 21(a)), but it outperforms placebo significantly more often (Figure 21(b)). However, glatiramer acetate is the top-ranked treatment slightly more frequently than beta-interferon (Figure 21(c)). This is due to the relatively high variance and skewness of the benefit-risk distribution for glatiramer acetate (Figure 15 and Figure 16).