
Direct Utility Elicitation
Value Functions
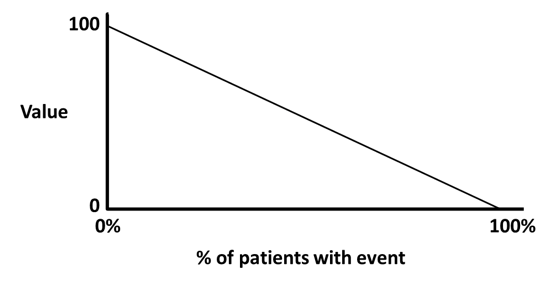
A linear value function is used for all outcomes whose performance levels can be measured by proportions (except relapses and convenience). The range of possible outcome measure for proportions is 0 to 1. The best outcome is assigned a value of 100 (this is all patients experiencing the unfavourable event). The worst outcome is assigned a value of 0 (this is all patients avoiding the unfavourable event). This assumes that each patient experiencing an unfavourable event is worth the same. See Figure 22.
Figure 22 Value function used for proportions
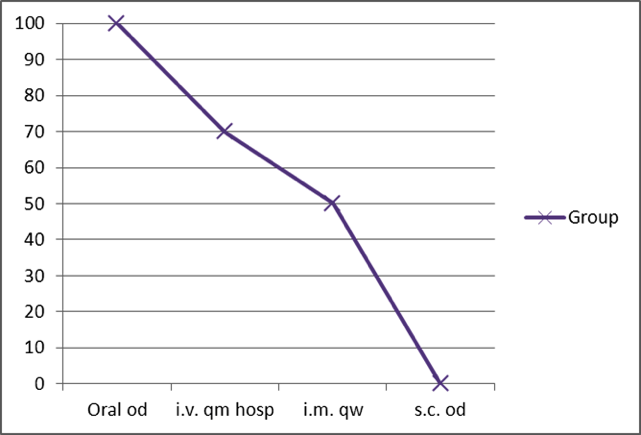
The 2-year relapse rate was also assigned a liner value function, but this had the best and worst outcomes defined at 0 and 2 relapses per two-years respectively. The convenience outcome is on a categorical scale, and the value of each route and frequency of administrate is elicited at the same time as the weights. The elicited value function is given Figure 23.
Figure 23 Value function for convenience
Weights
A bottom-up approach in the hierarchical value tree was used in the weighting process. This involved representatives of the European Multiple-Sclerosis Platform (EMSP) giving their values for weights. It was organised into two meetings: the first was to give an overview of the project and instructions on completing the questionnaire (Figure 24) and the second was a decision conference, following completion of the questionnaires, to reach group consensus for the weights being elicited.
Figure 24 Example questionnaire
Starting with each outcome measure, the relative ranks of a swing from the best to the worst of each outcome within each category are elected. Start from where all outcome scores are at the worst score, and choose the outcome you would most want to move to the best score. Then rank the other outcomes in a similar way. For this, the top ranked outcomes is given a weight of 100, and place the other outcomes on the scale to reflect their relative importance. The same approach is used to elicit weights between outcome categories, separately within benefits and risks. The top-ranked outcome from each category is used as a representative of its category. This top-ranked outcome in each category is ranked and weighted in the same way as before. Finally the benefits and risks are weighted using the same approach. Cross checks were performed, where the weights were converted into the number of patients that would have to have a pair of event avoided to be in equipoise.
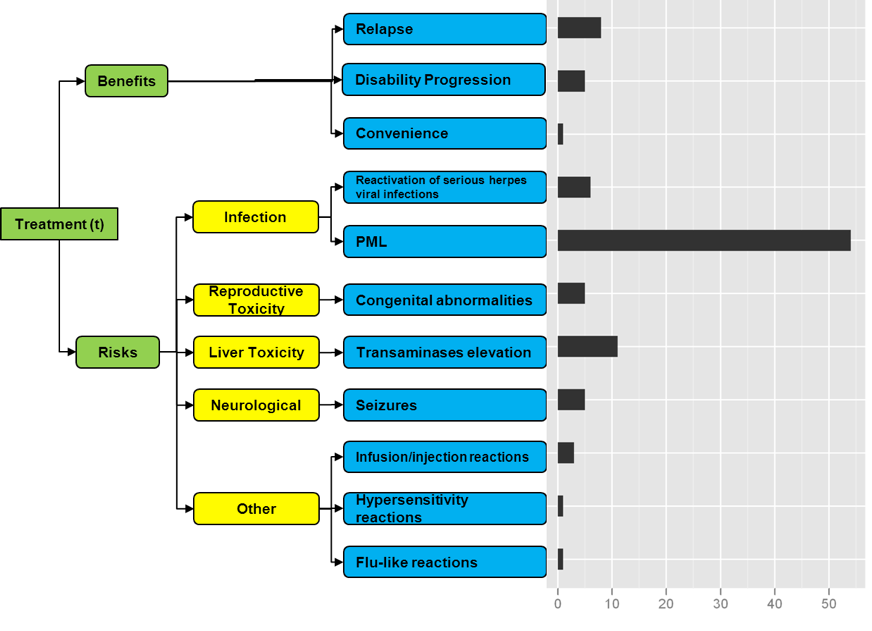
The weights elicited at the different levels of the hierarchy are then used to calculate the overall cumulative weights for each outcome. Essentially the weight of an outcome is elicited, and then it is increased in proportion to how much weight it represented lower in the hierarchy. The preference weight for relapses was elicited assuming a range out outcome between 0 and 1. As a range larger than this is needed, it is rescaled to the range 0 to 2, and so the swing weight needs to be doubled to account for this. So the actual weight of a single relapse is half that given in Figure 25. Table 18 shows the details of the elicited weights.
Figure 25 Preference weights for each outcome in the value tree
| Level 1 | Raw | Calibrated | Normalized | Level 2 | Raw | Calibrated | Normalized | Level 3 | Raw | Calibrated | Normalized | Weight | Adjusted | Nomalized | ||
|---|---|---|---|---|---|---|---|---|---|---|---|---|---|---|---|---|
| Group | Outcome | Category | Outcome | Final Weights | ||||||||||||
| Benefit | Convenience s.c. od --> Oral od | 1 | 0.01 | 0.01 | NA | 100 | 1 | 1.00 | Convenience s.c. od --> Oral od | 1 | 1 | 1% | 1% | 1% | ||
| Avoid disability progresison | 10 | 0.17 | 0.09 | NA | 100 | 1.7 | 1.00 | Avoid disability progresison | 100 | 1 | 0.59 | 6% | 6% | 5% | ||
| Avoid relapses | 70 | 0.7 | 0.41 | 4% | 8% | 8% | ||||||||||
| Risk | Avoid PML | 100 | 1.61 | 0.90 | Infections | Avoid PML | 100 | 1.12 | 0.70 | Avoid PML | 100 | 1 | 0.89 | 56% | 56% | 54% |
| Avoid reactivation of herpes viral infection | 12 | 0.12 | 0.11 | 7% | 7% | 6% | ||||||||||
| Liver | Avoid transaminases elevation | 20 | 0.2 | 0.12 | Avoid transaminases elevation | 1 | 1.00 | 11% | 11% | 11% | ||||||
| Neurological disorders | Avoid seizures | 10 | 0.1 | 0.06 | Avoid seizures | 1 | 1.00 | 6% | 6% | 5% | ||||||
| Other | Avoid infusion/injection site reactions | 5 | 0.09 | 0.06 | Aviod hypersensitivity reactions | 40 | 0.4 | 0.22 | 1% | 1% | 1% | |||||
| Avoid infusion/_njection site reactions | 100 | 1 | 0.56 | 3% | 3% | 3% | ||||||||||
| Avoid flu-like reations | 40 | 0.4 | 0.22 | 1% | 1% | 1% | ||||||||||
| Reproductive | Congenital abnormalities | 10 | 0.1 | 0.06 | Congenital abnormalities | 1 | 1.00 | 6% | 6% | 5% |