
BRAT Framework
Define the decision context
Two decision contexts were considered. The first was whether natalizumab should be given marketing approval at the time of first registration; on the basis that PML is a rare serious event to be balanced versus a clearly documented benefit on relapses and disease progression. The decision is mainly driven by patient preference and benefit-risk balance seems positive to the team on the basis of the elicited weights by the patient groups.
The second was whether natalizumab should be kept on the market given that episodes of PML are observed at the time that these episodes were observed (at time of CHMP re-evaluation); on the basis that though the occurrence of PML increased with more and longer exposure, the overall picture may change or remain the same.
Identify outcomes
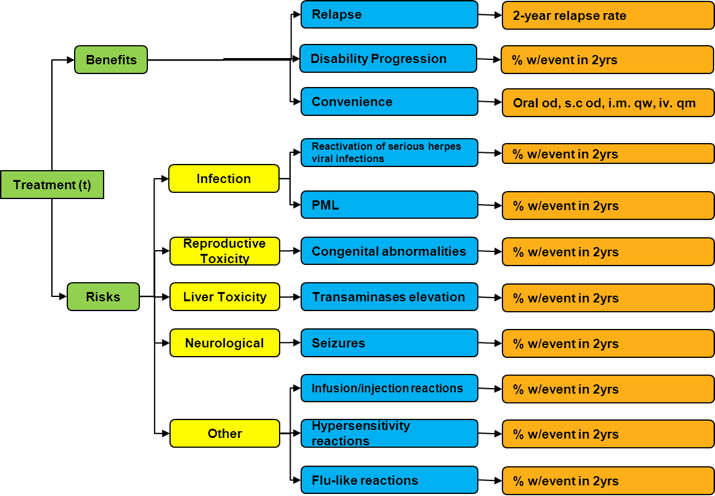
The value tree was prepared by individual experts based largely on data from the Summary of Product Characteristics (SPC) for natalizumab and the European Assessment report by EMA. A group decision was taken on the key benefits and risks to be included and it was agreed that PML should be included at time of simulated initial approval assessment as it was a potential risk at this point in time.
Figure 1 Value tree
Identify and extract source data
A two year time horizon for the decision was chosen as this is considered the minimum duration for the drugs to demonstrate efficacy. The sources of evidence to extract relevant data from are European public assessment reports (EPAR), “product information” and “scientific discussion”, and Literature search. Literature searching was carried out on two databases of English-language reports of controlled clinical trials assessing the efficacy and safety of alternative MS drugs for relapsing-remitting multiple sclerosis: EMBASE from 1980 to July 2011 and Ovid MEDLINE from 1948 to July 2011. In addition, reference searching from review papers and expert’s suggestion was also performed. Database searching was performed for each drug using a similar search strategy
Table 1 Literature searching and data selection strategy
| LITERATURE SEARCHING AND DATA SELECTION | |
|---|---|
| Interferon Beta-1a Interferon beta.m_titl. (title) Beta interferon.m_titl. Avonex.m_titl. [1] OR [2] OR [3] Multiple sclerosis.mp. and multiple sclerosis/ (Map term to subject heading) [4] AND [5] |
Glatiramer Acetate Glatirameracetate.m_titl. (title) Glatiramer acetatee.m_titl. Copolymer 1.m_titl. Cop 1.m_titl. [1] OR [2] OR [3] OR [4] |
| Natalizumab Natalizumab.m_titl. (title) Tysabri.m_titl. [1] OR [2] |
|
| Additional limits : English language AND Human AND (RCT or controlled clinical trial or phase II clinical trial or phase III clinical trial or phase IV clinical trial) | |
| Inclusion criteria for title and abstract screening: Clinical Trials for Relapsing-Remitting Multiple Sclerosis | |
| Exclusion criteria for title and abstract screening: Other Interferon beta not Avonex | |
| Inclusion Criteria for primary input data in MCDA model: Randomised placebo-controlled phase III clinical trial | |
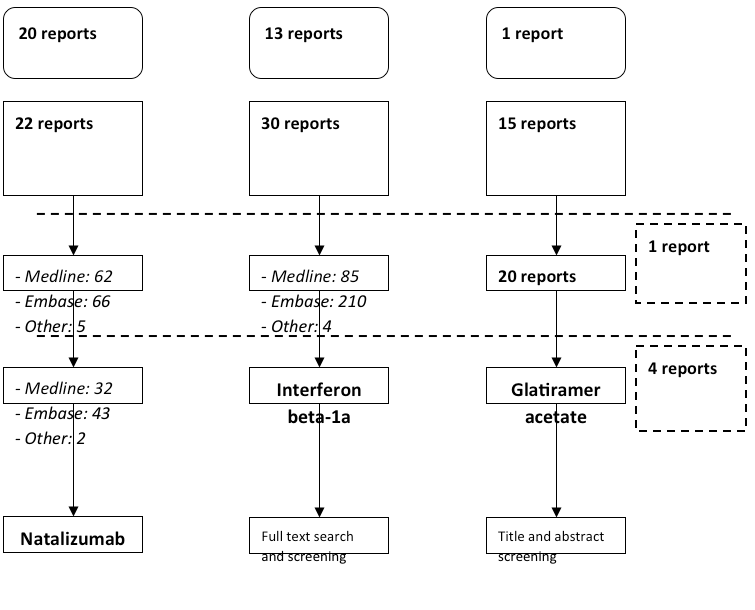
Figure 2 Literature search results
At the final screening stage four reports of three Phase III placebo-controlled clinical trials have been found for glatiramer acetate, three of which were then excluded for reasons given in Table 2.
Table 2 Excluded clinical trials
| Trials | Rationale for exclusion |
|---|---|
| Bornstein 1987 | Only pilot trial with small sample size and using match-pair randomisation |
| Johnson 1998 | Extension period over 2 years from the core trial (Johnson KP 1995) |
| Comi 2001 | Trial period was only 9 months |
Only one Phase III placebo-controlled trial has been found in each drug for natalizumab and interferon beta- 1a (Table 3). The proportions of subjects with at least one relapse in two years are shown in Table 4.
Table 3 Details of studies used in the analysis
| Drug | Author | Year | Exposure | Comparator | Details |
|---|---|---|---|---|---|
| Natalizumab | Polman CH | 2006 | 28 Months | Placebo | RRMS. Nov 2001: 942 patients - multiple centres and countries. 856 patients (91%) completed the 120-week trial |
| Interferon beta-1a | Jacobs LD | 1996 | 24 Months | Placebo | RRMS. Early 1993: 301 patients - 4 clinical centers US. |
| Glatiramer acetate | Johnson KP | 1995 | 24 months | Placebo | RRMS. October 1991-May 1992: 251 randomised. 215 completed 2-year trial. US population. |
Table 4 Proportion of subjects with at least one relapse in two years
| Treatment | Proportions in the original publications | Placebo-adjusted proportions |
|---|---|---|
| Natalizumab | 0.25 [Polman, 2006] | 0.28 |
| Interferon beta-1a | 0.62 [Johnson, 1995] | 0.45 (=0.54*(0.62/0.74)) |
| Glatiramer acetate | 0.664 [Jacobs, 1996] | 0.49 (=0.54*(0.664/0.73)) |
| Placebo | 0.54 [Polman, 2006] 0.74 [Johnson, 1995] 0.73 [Jacobs, 1996] | 0.54 |
The data extracted are summarised in a Master Data Summary table (Table 5). The data extracted are used to calculate the outcomes for each drug for each outcome on the scale of measurement given in the value tree. The data are measured on an absolute scale, as this is the scale that values need to be elicited. However, the studies were performed in different patient populations and at different points in time, so comparing absolute effects between treatment arms directly will be confounding the effect of the drug and the effect of the patient population. It is common practice in biostatistics to assume that the relative treatment or safety effect is robust to changes in patient population.
We compare drugs by taking a common placebo population, and finding the relevant absolute outcome given a drug by multiplying outcome in the placebo group with the appropriate relative rate. This is a simple form of network meta-analysis. The placebo group in the natalizumab trial is chosen as the common placebo group in most outcomes. However where there are missing data in natalizumab case, the common placebo group is chosen as the one with available data. For rare adverse events such as PML, herpes viral infections, or seizures, it has been assumed that no event is observed in the common placebo group, and the unadjusted outcome in the treatment arm is used.
Table 5 Master data summary table
| GROUP | CATEGORY | OUTCOME | MEASURE | DRUG | COMMON PLACEBO | RELATIVE VALUE | OUTCOME ON VALUE SCALE | ||
|---|---|---|---|---|---|---|---|---|---|
| DRUG | EST | DESCRIPTION | EST | EST | |||||
| Benefit | Relapse | Relapse | 2 year relapse rate | Placebo | Natalizumab PBO | 0.73 | rate ratio | 1 | 1.46 |
| Natalizumab | 0.73 | 0.32 | 0.47 | ||||||
| Interferon beta-1a | 0.73 | 0.82 | 1.19 | ||||||
| Glatiramer acetate | 0.73 | 0.71 | 1.04 | ||||||
| Disability progression | Disability progression | 6-month confirmed proportion progressing after 2 years | Placebo | Natalizumab PBO | 0.17 | hazard ratio | 1.00 | 0.23 | |
| Natalizumab | 0.17 | 0.46 | 0.11 | ||||||
| Interferon beta-1a | 0.17 | 0.58 | 0.14 | ||||||
| Glatiramer acetate | 0.17 | 0.77 | 0.18 | ||||||
| Convenience | Convenience | Route and frequency of adminsitration | Placebo | oral od | |||||
| Natalizumab | iv qm hosp | ||||||||
| Interferon beta-1a | im qw | ||||||||
| Glatiramer acetate | sc od | ||||||||
| Risk | Infection | Reactivation of serious herpes viral infections | Natalizumab PBO | event % | 0% | event ratio | 1 | 0% | |
| 0% | 1.00 | 0% | |||||||
| 0% | 1.00 | 0% | |||||||
| 0% | 1.00 | 0% | |||||||
| PML | 0% | ||||||||
| 0.151% | |||||||||
| 0% | |||||||||
| 0% | |||||||||
| Reproduction toxicity | Congenital abnormalities | 0% | |||||||
| 0.00% | |||||||||
| 0.00% | |||||||||
| Liver Toxicity | Transaminases elevation | ALT >5x ULN | Natalizumab PBO | event % | 4% | event ratio | 1 | 4.0% | |
| 4% | 1.25 | 5.0% | |||||||
| 4% | 1.00 | 4.0% | |||||||
| 4% | 1.00 | 4.0% | |||||||
| Neurological | Seizures | 0.5% | |||||||
| 0.5% | |||||||||
| 3.0% | |||||||||
| 0.0% | |||||||||
| Others | Infusion reactions/injection reactions | Natalizumab PBO | event % | 18% | event ratio | 1 | 0.0% | ||
| 18% | 1.34 | 23.6% | |||||||
| 18% | 1.00 | 17.6% | |||||||
| 18% | 1.53 | 26.9% | |||||||
| Hypersensitivity Reactions | Natalizumab PBO | event % | 0% | event ratio | 1.00 | 0.0% | |||
| 0% | 0.00 | 0.0% | |||||||
| 0% | 1.00 | 0.0% | |||||||
| 0% | 1.50 | 0.0% | |||||||
| Flu-like reactions | Interferon beta-1a PBO | event % | 40% | event ratio | 1.00 | 39.9% | |||
| 40% | 1 | 39.9% | |||||||
| 40% | 1.52 | 60.8% | |||||||
| 40% | 1 | 39.9% |
Customise the framework
This step was dealt simultaneously in Step 2 (Identify outcomes). At this step, we modified the initial value tree and outcomes according to data availability and clinical judgement of the importance of the criteria. We filtered the source table to allow data to be presented based on lower PML occurrence assumed at the time of approval and higher at the time of . We adapted the framework to adapt visual output in tables and forest plots to support decision making.
Assess outcome importance
We elicited weights from patient representatives at a decision conference held by teleconference on 23 September 2011 with two members of the European Multiple-Sclerosis Platform. We used a direct elicitation technique to compare disparate measures in the value tree they are put on a common scale by defining a value function and weight for each outcome. The preference value defines the within-outcome importance for each outcome, whilst the weight defines the between-outcome importance.
Display and interpret key benefit-risk metrics
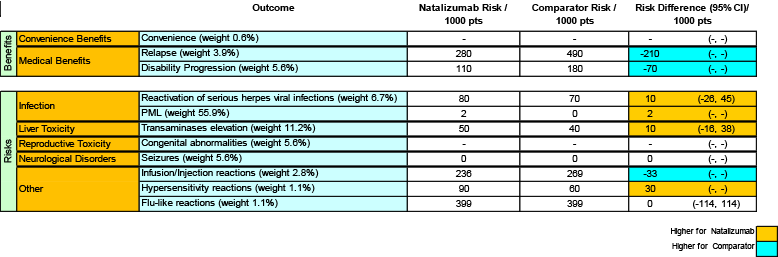
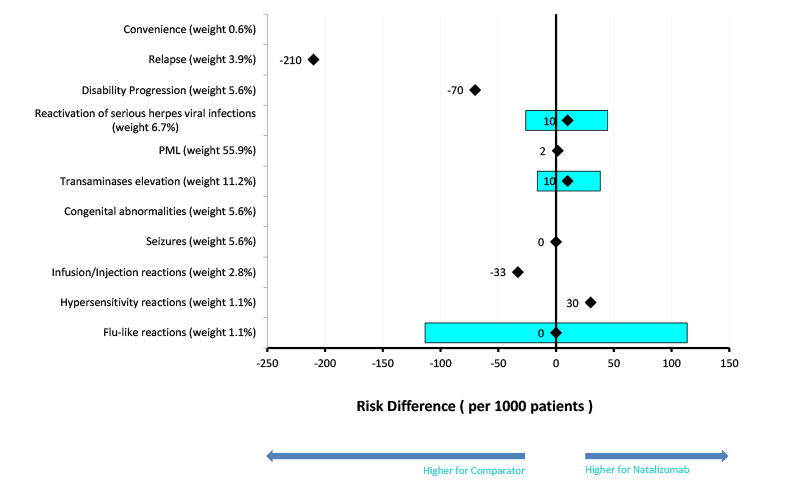
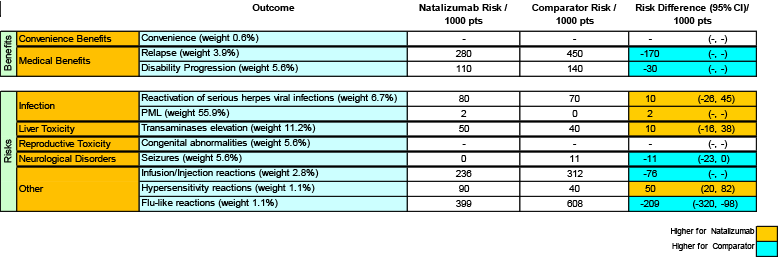
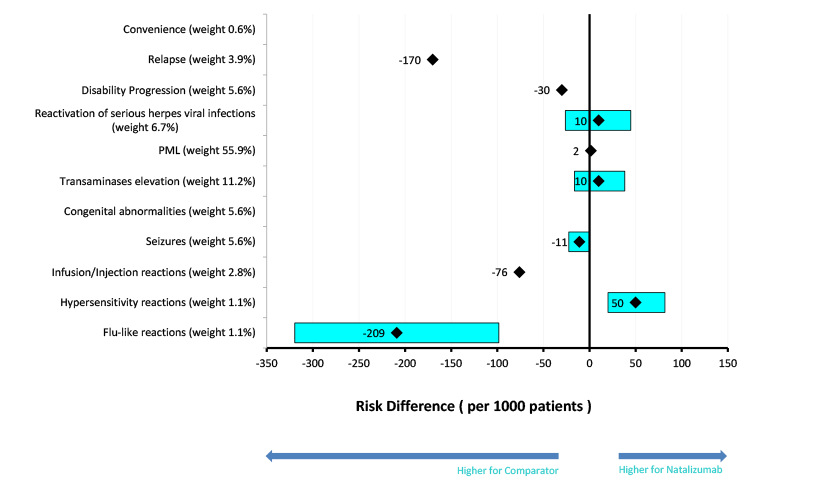
Table 6 to Table 8 are the Key Benefit-Risk Summary tables, summarising the benefit-risk profile of natalizumab against placebo, glatiramer acetate and interferon beta-1a, respectively. The accompanying forest plots for the key benefit-risk summary are given in Figure 3, Figure 4 and Figure 5.
Table 6 Natalizumab versus placebo (Comparator) at time of CHMP re-evaluation
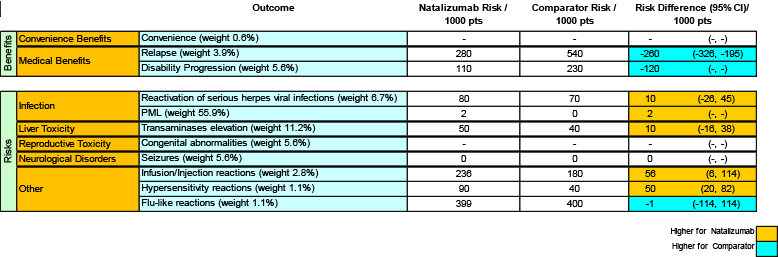
Figure 3 Natalizumab versus placebo (Comparator) at time of CHMP re-evaluation
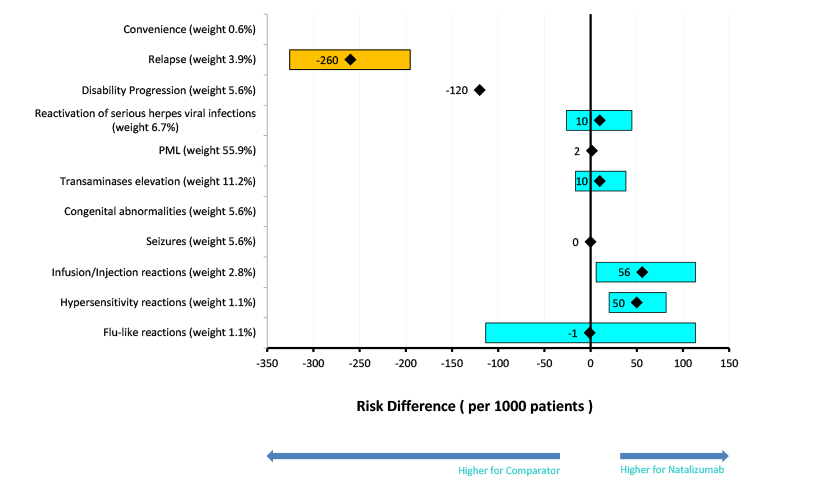
Table 7 Natalizumab versus glatiramer acetate (Comparator) at time of CHMP re-evaluation
Figure 4: Natalizumab versus glatiramer acetate (Comparator) at time of CHMP re-evaluation
Table 8 Natalizumab versus interferon beta-1a (Comparator) at time of CHMP re-evaluation
Figure 5: Natalizumab versus interferon beta-1a (Comparator) at time of CHMP re-evaluation