
Figure 21: Value function for all benefit-risk criteria (criteria)
Weights
The SMAA method has the advantage that the analysis can be carried out with missing and unknown weights, and weighting on an ordinal and a cardinal scale.
One of the problems encountered when constructing the value tree was that he criterion "Major Haemorrhage" was not consistently defined across studies, and may or may not be disabling. Consequently, preferences assigned to the criterion may have greater uncertainty. The SMAA analysis can give us a better understanding of the impact of different preferences and their uncertainties on the benefit-risk balance. Two different weight scenarios were explored:
- Scenario A: The weight on each criterion corresponds to the disutility assigned in the Pink paper from 2012. 1The criteria "all-cause mortality" was not reported in the Pink2012 analysis,1 and for this scenario we assume a value of 0.4. (See table 17)
- Scenario B: Criteria "Disabling Ischaemic Stroke" and "Major Haemorrhage" are assumed tocarry the same weight. This is equivalent to assuming all "Major Haemorrhage" events are disabling (See table 18).
Since the weights from the literature disregard value functions for individual's disutility, they essentially already implicitly accounted for both weights and utilities. The value functions and data to be used in our SMAA model may be different to the ones accounted for in the literature, and therefore we need to ??normalise?? the disutility values so that the total adds up to 1. This ensures that the weights and utilities in the final SMAA model match to the ones from the literature. To further explore the typical preference profile of a decision-maker in relation to treatment options, we conduct an analysis using missing weights assuming that these weights are uniformly distributed between values of 0 and 1.
Normalising weights for use in SMAA model
Scenario A: The weights are elicited directly based on the relative relationship of the disabilities described in the Pink 2012 study. The disutility for 'all-cause mortality' was not given in the Pink 2012 study, and here it is assigned the disutility value of 0.4. The normalised disutility values that act as a constraint to the SMAA model are given in Table 17
Table 17: Overview of the weights on five criteria for scenario A. The criteria are weighted according to Pink2012 disutility values; it is assumed that the disutility values give the relative difference between one extra event in any of the criteria
| Criteria | Importance | Disutility Pink2012 | Normalised* |
|---|---|---|---|
All-cause Mortality
| High |
0.4+ |
0,41 |
|
Disabling Ischaemic Stroke
| |
0,233 |
0,24 |
|
Major Haemorrhage
| |
0,1385 |
0,14 |
|
Non-disabling Ischaemic Stroke
| |
0,1385 |
0,14 |
|
Minor Haemorrhage
| Low |
0,06 |
0,06 |
|
| + Not from Pink2012 * Normalised weights are calculated as the proportion of its disutility to the total disutility |
|||
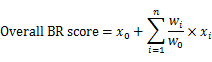
We can then calculate the overall BR score as:
Stochastic Multi-criteria Acceptability Analysis (SMAA)
The SMAA method was used in connection to the warfarin case study WS1 were the benefit-risk balance of warfarin versus placebo for primary prevention of stroke in patient with atrial fibrillation was explored. The SMAA method was specific used to explore uncertainty relating to data variability and the preferences.
where x0 and w0 are the value and the normalised weight of the key event (\'all-cause mortality\'), and xi (i=1,2,...,n) and wi (i=1,2,...,n) are the values and the normalised weights of other events. From the table above for scenario A, the overall BR score can be expressed as follows:
Overall BR score = ( \'All-cause Mortality\') + (0.58 x \'disabling Ischaemic Stroke\') + (0.35 x \'Major Haemorrhage\') + (0.35 x \'Non-disabling Ischaemic Stroke\') + (0.15 x \'Minor Haemorrhage\')
Scenario B:All "Major Haemorrhages" are considered to be disabling with or without loss of independent function (as "Disabling Ischaemic Stroke"). Table 18 shows how the weights to be assigned to the criteria in this scenario were modified from Pink,1 alongside their normalised values for the subsequent SMAA model.
Table 18: Overview of the weights on five criteria for scenario B. The criteria weighs are based on Pink2012 disutility values; As for scenario A the disutility value for "All-cause mortality" is not from Pink. In this scenario B, the disutility of "Major Haemorrhage" is set to be equal to "Disabling Ischaemic Stroke".
| Criteria | Importance | Disutility Pink2012 | Normalised* |
|---|---|---|---|
All-cause Mortality | High | 0.4+ | 0,376 | |
Disabling Ischaemic Stroke | | 0,233 | 0,219 | |
Major Haemorrhage | | 0,233+ | 0,219 | |
Non-disabling Ischaemic Stroke | | 0,1385 | 0,13 | |
Minor Haemorrhage | Low | 0,06 | 0,56 | |
| + Not from Pink2012 * Normalised weights are calculated as the proportion of its disutility to the total disutility | |||
As previous described for scenario A
Overall BR score = ( \"All-cause Mortality\") + (0.58 x \"Disabling Ischaemic Stroke\") + (0.58 x \"Major Haemorrhage\") + (0.35 x \"Non-disabling Ischaemic Stroke\") + (0.15 x \"Minor Haemorrhage\")
Results
Given our model we find, from the SMAA analysis of scenario A, that the probability for warfarin to come out best compared to control is nearly 1. For scenario B our analysis does not show a significant change, giving a probability of about 0.99 that warfarin will come out best compared to control.
To further explore the possible outcomes of the benefit-risk model,an analysis using missing weights was done. From this we can determine the central weight vector for each alternative that is ranking best. The warfarin central weight will be denoted Scenario (W) and the control central weight will be denoted Scenario (C).
Figure 22: To the right the weights for each endpoint normalised with respect to \"All-cause Mortality\" for the four different scenarios, and to the left the probability of warfarin ranking best under the four different scenarios
The SMAA analysis suggests that there is a fairly wide weight space where warfarin will have a high probability of having the best overall benefit-risk score. The missing weight analysis showed that even with a major haemorrhage event having a weight of more than double of the weight of a mortality event or a disabling ischaemic stroke event, there is a very high pobability of warfarin having the best overall benefit-risk score (around 0.99 or 99 percent).
To put this in another way, we need to have one minor haemorrhage event weighting more than a mortality or disabling ischaemic stroke event, and a major haemorrhage event having several fold higher weight than mortality or disabling stroke event to overturn the positive benefit risk balance for warfarin in atrial fibrillation