
BRAT Framework
| Step | Description |
|---|---|
| 1. Define the decision context | Warfarin is an anti-coagulating agent for prevention of stroke in patients with atrial fibrillation Dose: Adjusted dose Warfarin Comparators:
Based on clinical trial data are the BR balance of warfarin versus placebo deemed positive? Does inclusion of observational data change the BR of warfarin? Based on data from newer RCTs are the BR of warfarin deemed positive against Rivaroxaban, Dabigatran and Apixaban? Does data from newer RCTs change our beliefs about the benefit-risk of warfarin versus placebo? |
| 2. Identify outcomes | Outcomes for the assessment are defined in the final value tree in figure 1 and alternate value tree was defined in Figure 2. |
| 3. Identify and extract source data | EPARs and Literature searching |
| 4. Customise the framework | To minimise the decision problem to a purely medical one, the risk category of inconvenience was excluded in the customised framework |
| 5. Assess outcome importance | Disutility values from Pink et al. 2012 |
| 6. Display and interpret key benefit-risk metrics | Visualisations Forest plots Key summary table Pictograms Bar charts |
1. Define the decision context
The decision context considered in this case study was many folded. First, is the benefit-risk of warfarin versus placebo for primary stroke prevention in patients with atrial fibrillation considered positive, given the available RCTs? Second, does data from observational studies change our beliefs about the benefit-risk of warfarin versus placebo for primary prevention of stroke in patients with atrial fibrillation? And finally, given new RCT date of warfarin versus newer anti-coagulation agents (apixaban, dabigatran and riveroxaban) can the benefit-risk of warfarin for primary stroke prevention for atrial fibrillation considered positive?
2. Identify outcomes
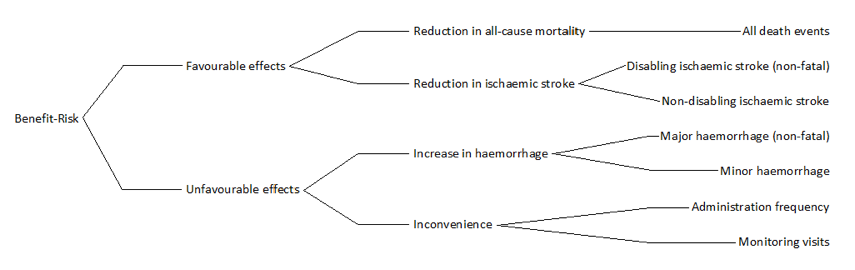
During a face-to-face brainstorm session the case study group discussed the outcomes for the benefit-risk assessment and constructed the initial value tree. This tree was refined in several steps, due to data availability (data to inform each criterion) and to ensure the minimization of double-counting, the final value tree is shown in Using data from individual patients, a NCB/individual harm-benefit model was created.With this model, differences in the benefit risk balance of warfarin for stroke prevention in patients with atrial fibrillation were investigated. The benefit-risk balance was stratified based on baseline risk of stroke and bleeds. With the model it was possible to identify groups with higher and lower possibility of a favourable benefit-risk with warfarin.
Figure 1Final value tree
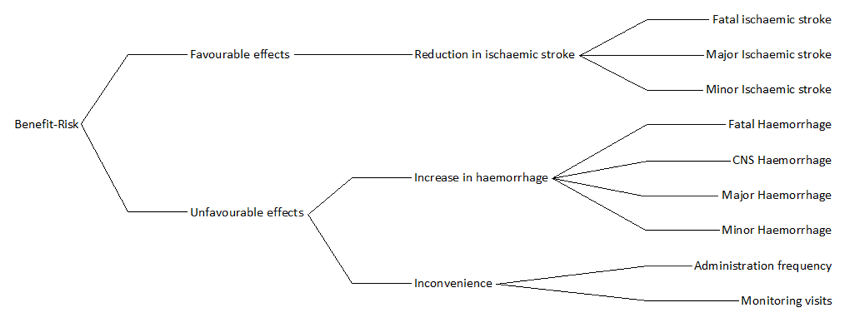
An alternate value tree was constructed for comparison (Figure 2). This tree was included to ensure that the preference compatible between criteria in the benefit and risks branches was taken into account in the final benefit-risk considerations
Figure 2: Alternate value tree
To assess warfarin versus apixaban, riveroxaban and dabigatran the benefit-risk criteria are chosen to match the criteria defined in the final value tree (see figure 1) to the extent possible, considering data availability.
3. Identify and extract source data
Data was identified and extracted from European public assessment reports (EPAR), "product information" and "scientific discussion", and in the published literature.
A systematic literature search was conducted for reviews and/or meta-analyses of RCTs comparing warfarin versus placebo for the primary prevention of stroke in patients with atrial fibrillation.For details on the literature search seeappendix 1.
Of the 37 identified reviews or meta-analysis of warfarin for stroke prevention in atrial fibrillation only one included the endpoint relevant for this benefit-risk analysis. By a review of all 37 studies, we were able to identify only 7 different RCT with direct comparison between warfarin and placebo for stroke prevention in atrial prevention, five for the primary prevention and one for secondary prevention. The review of the 37 studies also identified7 observational studies for primary prevention of stroke in patients with atrial fibrillation using warfarin.
Data used for the benefit-risk assessment of warfarin versus control for primary prevention of stroke in patients with atrial fibrillation are shown in table 2 and table 3, for the final value tree and the alternate value tree, respectively. This step of identifying and extracting source data was done in close connection to the BRAT step Identify outcomes, and the process was parallel or circular rather than in a consecutive way (seeConstruction of value-tree).
Although it was initially intended to inform criteria from published meta-analysis, we ended up going back to the original RCT studies in order to get the best combination of benefit-risk criteria minimising the risk of double counting and data availability. Only the criteria all-cause mortality was informed based on data from a published meta-analysis study.2The study calculated overall treatment effect using fixed-effect model (Petomethod), however for the purpose of benefit-risk assessment odds ratio metric can be quite difficult to interpret, especially when balancing across different criteria with different underlying frequencies, instead the metric risk difference was calculated for each criteria.
Table 2: Date source tablefor final value tree
| Category | Outcome | Study | Duration | Warfarin | Control | |||
|---|---|---|---|---|---|---|---|---|
| years | cases | Total | cases | Total | ||||
Benefits
| Reduction in all-cause mortality |
All-cause mortality |
AFASAK I |
1.2 |
20 |
335 |
28 |
336 |
|
| BAATAF | 2.2 | 11 | 212 | 26 | 208 | |||
| CAFA | 1.3 | 10 | 187 | 8 | 191 | |||
| SPAF I | 1.2 | 6 | 210 | 8 | 211 | |||
| SPINAF | 1.7 | 22 | 281 | 29 | 290 | |||
| Reduction in ischemic stroke | Disabling ischaemic stroke | AFASAK | 1.2 | 4 | 335 | 7 | 336 | |
| BAATAF | 2.2 | 2 | 212 | 8 | 208 | |||
| SPINAF | 1.7 | 3 | 260 | 9 | 265 | |||
| SPAF | 1.2 | 2 | 210 | 7 | 211 | |||
| Non-disabling ischaemic stroke | AFASAK | 1.2 | 0 | 335 | 5 | 336 | ||
| BAATAF | 2.2 | 0 | 212 | 4 | 208 | |||
| SPINAF | 1.7 | 0 | 260 | 9 | 265 | |||
| SPAF | 1.2 | 4 | 210 | 10 | 211 | |||
Risk
| Increase in haemorrhage |
All-cause mortality |
AFASAK I |
1.2 |
20 |
335 |
28 |
336 |
|
| BAATAF | 2.2 | 7 | 212 | 7 | 208 | |||
| CAFA | 1.3 | 3 | 187 | 1 | 191 | |||
| SPINAF | 1.7 | 7 | 260 | 4 | 265 | |||
| SPAF | 1.2 | 3 | 210 | 4 | 211 | |||
| Minor haemorrhage | AFASAK | 1.2 | 20 | 335 | 0 | 336 | ||
| BAATAF | 2.2 | 32 | 212 | 14 | 208 | |||
| CAFA | 1.3 | 2 | 187 | 0 | 191 | |||
| SPINAF | 1.7 | 64 | 260 | 46 | 265 | |||
Note:
- Data from Aguilar study
- Major Ischemic stroke – disabling both with and without loss of independent function (non-fatal)
- Mild ischemic stroke –Leaving little or no definite functional disability a month after onset
- Major haemorrhage – Requiring medical intervention also including CNS haemorrhage (non-fatal)
- Minor haemorrhages – all other (non-fatal)
Table 3: Data table for alternate value tree
| Category | Outcome | Study | Duration | Warfarin | Control | |||
|---|---|---|---|---|---|---|---|---|
| years | cases | Total | cases | Total | ||||
Benefits
| Reduction in ischaemic stroke |
Fatal Ischaemic Stroke |
AFASAK |
1.2 |
1 |
335 |
4 |
336 |
|
| BAATAF | 2.2 | 0 | 212 | 1 | 208 | |||
| SPINAF | 1.7 | 1 | 260 | 1 | 265 | |||
| SPAF | 1.2 | 0 | 210 | 0 | 211 | |||
| Major Ischaemic Stroke | AFASAK | 1.2 | 4 | 335 | 7 | 336 | ||
| BAATAF | 2.2 | 2 | 212 | 8 | 208 | |||
| SPINAF | 1.7 | 3 | 260 | 9 | 265 | |||
| SPAF | 1.2 | 2 | 210 | 7 | 211 | |||
| Minor Ischaemic Stroke | AFASAK | 1.2 | 0 | 335 | 5 | 336 | ||
| BAATAF | 2.2 | 0 | 212 | 4 | 208 | |||
| SPINAF | 1.7 | 0 | 260 | 9 | 265 | |||
| SPAF | 1.2 | 4 | 210 | 10 | 211 | |||
Risk
| Increase in Haemorrhage |
Fatal Haemorrhage |
AFASAK |
1.2 |
1 |
335 |
0 |
336 |
|
| BAATAF | 2.2 | 1 | 212 | 1 | 208 | |||
| CAFA | 1.3 | 2 | 187 | 0 | 191 | |||
| SPINAF | 1.7 | 0 | 260 | 1 | 265 | |||
| SPAF | 1.2 | 1 | 210 | 0 | 211 | |||
| CNS Haemorrhage | BAATAF | 2.2 | 0 | 212 | 0 | 208 | ||
| CAFA | 1.3 | 0 | 187 | 0 | 191 | |||
| SPINAF | 1.7 | 1 | 260 | 0 | 265 | |||
| SPAF | 1.2 | 1 | 210 | 2 | 211 | |||
Note:
- Major Ischemic stroke – disabling both with and without loss of independent function (non-fatal)
- Mild ischemic stroke –Leaving little or no definite functional disability a month after onset
- CNS Haemorrhage – Excluding fatal events
- Major haemorrhage – Requiring medical intervention excluding CNS haemorrhage (non-fatal)
- Minor haemorrhage – all other (non-fatal)
- N/A – data not available
Data from observational and actual practice studies are displayed in table 4, the criteria are chosen to match as close as possible the criteria described in the final value tree. However most for most of the studies only included the outcome ischaemic stroke (including both fatal, major and minor ischaemic stroke)
Table 4: Data table for observational and actual practice studies
| Study | Mean study duration (years) | cases | total | ||
|---|---|---|---|---|---|
| Benefit | All-cause mortality | Jacobs2009 | 1.0 | 18 | 90 |
| Ischaemic stroke | Kalra2000 | 1.9 | 6 | 167 | |
| Darkow2007 | 1.3 | 183 | 4895 | ||
| Go2003 | 2.0 | 141 | 6320 | ||
| Caro1999 | 2.5 | 4 | 87 | ||
| Major Ischemic stroke | Gottlieb1994 | 2.1 | 5 | 186 | |
| Risk | Major haemorrhage | Kalra2000 | 2.1 | 5 | 167 |
| Gottlieb1994 | 2.0 | 2 | 156 | ||
| Caro1999 | 2.5 | 3 | 87 | ||
| Hylek2007<80 | 0.8 | 12 | 319 | ||
| Hylek2007≥80 | 0.7 | 14 | 153 | ||
| Minor Haemorrhage | Kalra2000 | 2.1 | 18 | 167 | |
| Gottlieb1994 | 2.0 | 36 | 186 | ||
| Caro1999 | 2.5 | 45 | 87 |
Finally data to support the assessment of warfarin versus the newer anti-coagulating agents, rivaroxaban,10apixaban11 and dabigatran12 was identified, data were extracted from EPAR and study papers see table 5.
Table 5: Data table for the assessment of warfarin versus the newer anti-coagulating agents, riveroxaban, apixaban and dabigatran
| Category | Criteria | Study | Comparator | Duration | Comparator | Warfarin | |||||
|---|---|---|---|---|---|---|---|---|---|---|---|
| years | cases | Total | %/year | Cases | Total | %/year | |||||
Favourable effects | Reduction in All-Cause Mortality | All-cause mortality | ARISTOTLE | Apixaban | 1.8 | 603 | 9120 | 3.52 | 669 | 9081 | 3.94 | |
| ROCKET-AF | Rivaroxaban | 1.9 | 621 | 7081 | 4.58 | 667 | 7090 | 4.92 | |||
| RE-LY | Dabigatran, 110mg | 2.0 | 446 | 6015 | 3.75 | 487 | 6022 | 4.13 | |||
| RE-LY | Dabigatran, 150mg | 2.0 | 438 | 6076 | 3.64 | 487 | 6022 | 4.13 | |||
| Reduction in Stroke | All Stroke | ARISTOTLE | Apixaban | 1.8 | 199 | 9120 | 1.19 | 250 | 9081 | 1.51 | |
| ROCKET-AF | Rivaroxaban | 1.6 | 184 | 7061 | 1.65 | 221 | 7082 | 1.96 | |||
| Ischemic Stroke | ROCKET-AF | Rivaroxaban | 1.6 | 149 | 7061 | 1.34 | 161 | 7082 | 1.42 | ||
| RE-LY | Dabigatran, 110mg | 2.0 | 159 | 6015 | 1.34 | 142 | 6022 | 1.2 | |||
| RE-LY | Dabigatran, 150mg | 2.0 | 111 | 6076 | 0.92 | 142 | 6022 | 1.2 | |||
| Fatal or Disabling Strok | ARISTOTLE | Apixaban | 1.8 | 84 | 9120 | N/A | 117 | 9081 | N/A | ||
| RE-LY | Dabigatran, 110mg | 2.0 | 112 | 6015 | 0.94 | 118 | 6022 | 1 | |||
| RE-LY | Dabigatran, 150mg | 2.0 | 80 | 6076 | 0.66 | 118 | 6022 | 1 | |||
| Fatal Stroke | ARISTOTLE | Apixaban | 1.8 | 42 | 9120 | N/A | 67 | 9081 | N/A | ||
| ROCKET-AF | Rivaroxaban | 1.6 | 47 | 7061 | 0.42 | 67 | 7082 | 0.59 | |||
| Disabling Stroke | ARISTOTLE | Apixaban | 1.8 | 42 | 9120 | N/A | 50 | 9081 | N/A | ||
| ROCKET-AF | Rivaroxaban | 1.6 | 43 | 7061 | 0.39 | 57 | 7082 | 0.5 | |||
| Non-disabling Stroke | ARISTOTLE | Apixaban | 1.8 | 115 | 9120 | N/A | 133 | 9081 | N/A | ||
| ROCKET-AF | Rivaroxaban | 1.6 | 88 | 7061 | 0.79 | 87 | 7082 | 0.77 | |||
| RE-LY | Dabigatran, 110mg | 2.0 | 60 | 6015 | 0.5 | 69 | 6022 | 0.58 | |||
| RE-LY | Dabigatran, 150mg | 2.0 | 44 | 6076 | 0.37 | 69 | 6022 | 0.58 | |||
Unfavourable effects | Increase in Haemorrhage | Haemorrhagic Stroke | ROCKET-AF | Rivaroxaban | 1.6 | 29 | 7061 | 0.26 | 50 | 7082 | 0.44 | |
| RE-LY | Dabigatran, 110mg | 1.2 | 14 | 6015 | 0.2 | 45 | 6022 | 0.38 | |||
| RE-LY | Dabigatran, 150mg | 2.0 | 12 | 6076 | 0.1 | 45 | 6022 | 0.38 | |||
| Fatal Bleed | ARISTOTLE | Apixaban | 1.8 | 34 | 9120 | N/A | 55 | 9081 | N/A | ||
| ROCKET-AF | Rivaroxaban | 1.9 | 27 | 7111 | 0.2 | 55 | 7125 | 0.5 | |||
| RE-LY | Dabigatran, 110mg | 2.0 | 23 | 6015 | 0.19 | 39 | 6022 | 0.33 | |||
| RE-LY | Dabigatran, 150mg | 2.0 | 28 | 6076 | 0.23 | 39 | 6022 | 0.33 | |||
| Major Bleed | ARISTOTLE | Apixaban | 1.7 | 38 | 9088 | N/A | 459 | 9052 | N/A | ||
| ROCKET-AF | Rivaroxaban | 1.4 | 579 | 7111 | N/A | 536 | 7125 | N/A | |||
| RE-LY | Dabigatran, 110mg | 2.0 | 319 | 6015 | N/A | 382 | 6022 | N/A | |||
| RE-LY | Dabigatran, 150mg | 2.0 | 371 | 6076 | N/A | 382 | 6022 | N/A | |||
| Minor Bleed | ROCKET-AF | Rivaroxaban | 1.4 | 1185 | 7111 | N/A | 1151 | 7125 | N/A | ||
| RE-LY | Dabigatran, 110mg | 2.0 | 1566 | 6015 | 13.16 | 1931 | 6022 | 16.37 | |||
| RE-LY | Dabigatran, 150mg | 2.0 | 1787 | 6076 | 14.84 | 1931 | 6022 | 16.37 | |||
4. Customise the framework
As this assessment is taken from the regulator perspective the inconvenience criteria was removed to restrict the problem to a purely medical one. However, for the individual patient the inconvenience criteria could be of high important for the BR decision.
5. Assess outcome importance
For this analysis the benefit-risk criteria will be rank ordered according to utility (a subjective measure that describes preferences (satisfaction, risk attitude) for an outcome). The order will be based on the disutility value for the criteria given in the Pink 2012 study.1 The tables below give the rank order of the criteria with the top being of highest importance and the bottom one of least importance.
Table 6: Weighting criteria on an ordinal scale (rank order)
| Criteria | Rank Order | Disutility Pink2012 (REF) |
|---|---|---|
| Reduction in all-cause mortality | High | - |
| Reduction non-disablingischaemic stroke | 0.233 | |
| Increase in major haemorrhage | 0.1385 | |
| Reduction in non-disabling ischaemic stroke | 0.1385 | |
| Increase in minor haemorrhage | Low | 0.06 |
6. Display and interpret key benefit-risk metric
Warfarin versus placebo for primary prevention of stroke in patient with atrial fibrillation
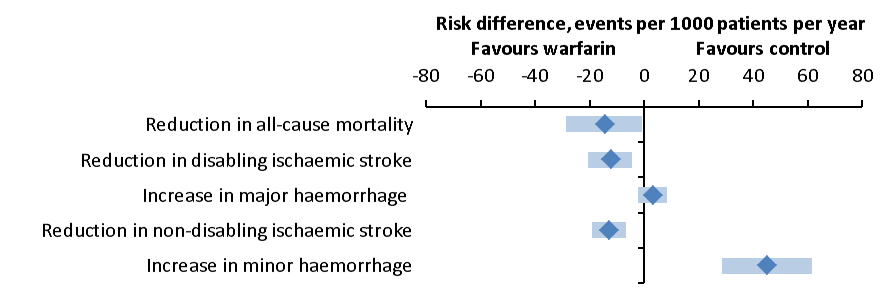
Table 7: Key benefit-risk summary table, for the assessment of warfarin versus placebo for primary prevention of stroke in patients with atrial fibrillation. The benefit-risk metric is risk difference per 1000 patient per year, the benefit-risk criteria are listed according to importance with the criteria of highest importance in the top.
| Benefit-risk criteria | Risk difference, events per 1000 patient per year (CI95%) | Log Peto Odds ratio (CI95%) |
|---|---|---|
| Reduction in all-cause mortality | -14.70 (-28.58, -0,82) | -0.36 (-0.20, -0.07) |
| Reduction in disabling ischaemic stroke | -12.54 (-20.56, -4.52) | -0.97 (-1.58, -0.36) |
| Increase in major haemorrhage | 2.88 ( -2.42, 8.17) | 0.26 (-0.38, 0.93) |
| Reduction in non-disabling ischaemic stroke | -12.95 (-19.34, -6.55) | -1.53 (-2.23, -0.83) |
| Increase in minor haemorrhage | 44.98 ( 28.52, 61.45) | 0.76 ( 0.40, 1.08) |
Figure 3: Forest plot illustrating the consequence of warfarin versus control on the five benefit-risk criteria. The diamonds represent the point estimate of the benefit-risk metric and the bar the 95%CI interval. Points to the left (negative values) represent a favour of warfarin and point to the right of control. The benefit-risk criteria are listed according to importance, with the criterion of highest importance in the top.
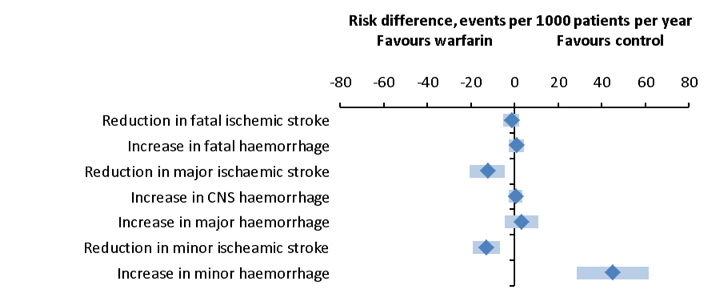
Table 8: Key benefit-risk summary table, based on the alternative value tree, the risk difference is based on data from RCTs (REF)
| Benefit-risk criteria | Risk difference, events per 1000 patient per year (CI95%) |
|---|---|
Reduction in fatal ischemic stroke | -1.56 (-5.13, 2.01) | |
Increase in fatal haemorrhage | 0.79 (-2.58, 4.15) | |
Reduction in major ischaemic stroke | -12.54 (-20.56, -4.52) | |
| Increase in CNS haemorrhage | 0.35 (-2.77, 3.48) |
Increase in major haemorrhage | 3.06 (-4.61, 10.74) | |
| Reduction in minor ischaemic stroke | -12.95 (-19.34, -6.55) |
| Increase in minor haemorrhage | 44.98 (28.52, 61.45) |
Figure 4: Forest plot showing the effect of warfarin treatment versus placebo, criteria based on the alternate value tree.
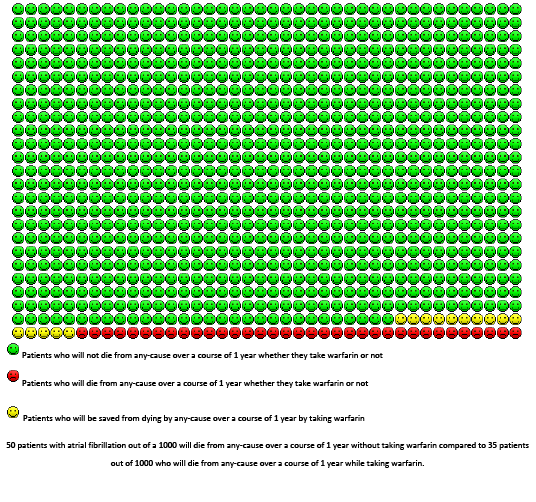
Figure 5: The pictogram represents the performance of warfarin versus control for primary prevention of stroke in patients with atrial fibrillation on all-cause mortality. The data is based on meta-analysis; the mortality rate averaged 5% per year in control group
Comparing data from RCTs to observational/actual practice studies
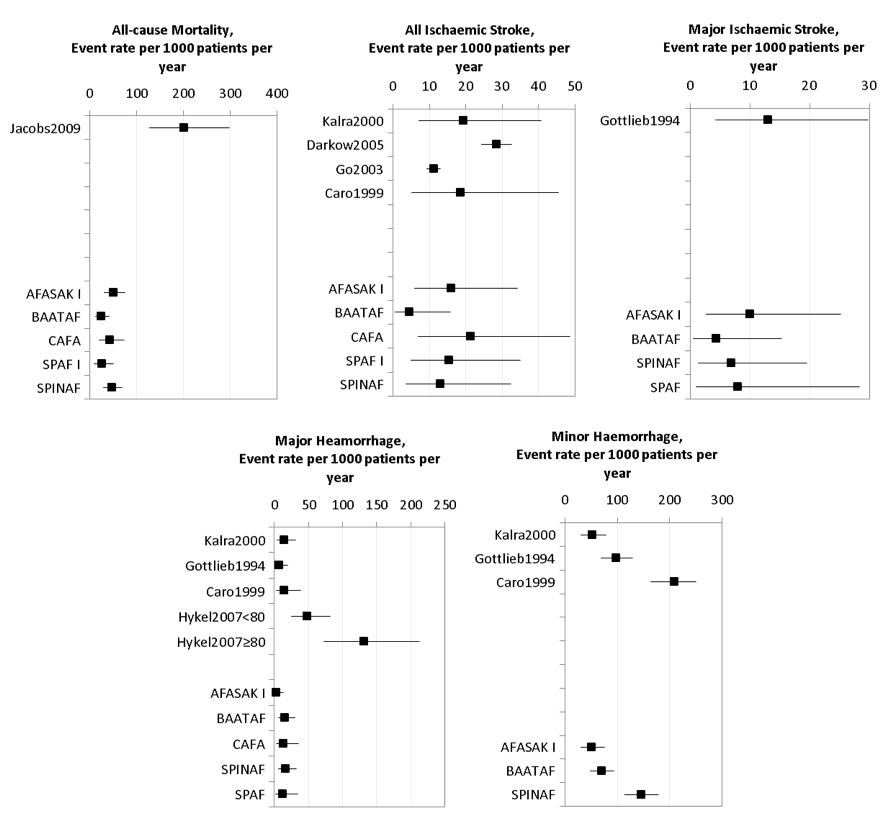
Figure 6: Effect of warfarin versus no treatment in observational studies, to be compared to warfarin versus placebo in RCTs.
Table 9: Study characteristics for RCTs and observational studies
| Study | Mean age, y | Gender, male, % | Prior stroke, % | Diabetes, % | Hypertension, % | Heart Failure, % | Angina, % |
|---|---|---|---|---|---|---|---|
| AFASAK I | - | 53 | 5 | 7 | 32 | 50 | 19 |
| BAATAF | 68.5 | 75 | 3 | 14 | 51 | 24 | 23 |
| CAFA | 68 | 75.9 | 3.2 | 13.9 | 43.3 | 23.5 | 21.9 |
| SPAF I | 64 | 74 | 8 | 12 | 49 | N | - |
| SPINAF I | 67 | 100 | - | 17 | 55 | 31 | 22 |
| Gottlieb1994 | 87.7 | 66 | 27 | 26 | 53 | 42 | 24 |
| Caro1999 | 70.8 | 66 | 21 | 24 | 43 | 34 | 21 |
| Kalra2000 | 77 | 40 | 14 | 15 | 43 | 20 | - |
| Go2003 | 71 | 59.2 | 10.9 | 18.2 | 51.6 | 33.1 | - |
| Darkow2005 | 79.8 | 45.5 | 6.2 | 17.3 | 37.1 | - | - |
| Hylek2007(<80) | 73 | 57 | 3 | 19 | 71 | 23 | - |
| Hylek2007(>80) | 84 | 45 | 9 | 24 | 83 | 37 | - |
| Jacobs2011 | 82 | 22 | - | - | - | - | - |
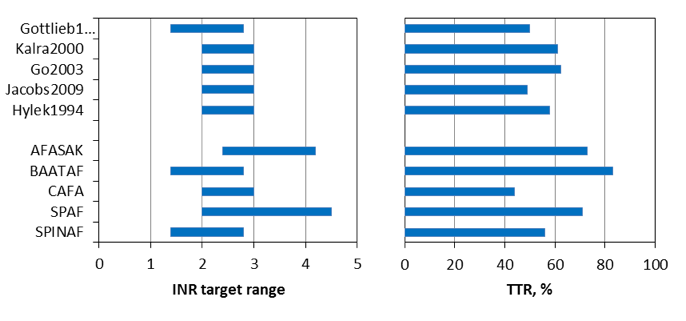
Figure 7: To the left INR target in observational studies (at the top) and RCTs (at the bottom) and time spent in target range (TTR, %) in the right figure.
- Warfarin versus dabigatran 110mg and dabigatran 150 mg
Table 10: Key benefit-risk summary table – warfarin versus dabigatran, 110 mg.
| Criteria | Drug | Comparator | Risk Difference per 1000 patients per year (95%CI) |
|---|---|---|---|
Reduction in all-cause mortality | Warfarin | Dabigatran, 110 mg | 3.36 (-1.61, 8.33) | |
Reduction in disabling Stroke | Warfarin | Dabigatran, 110 mg | 0.49 (-1.98, 2.96) | |
| Increase in major haemorrhage** | Warfarin | Dabigatran, 110 mg | 5.20 (0.89, 9.51) |
Reduction in non-disabling stroke | Warfarin | Dabigatran, 110 mg | 0.74 (-1.11, 2.59) | |
Increase in minor haemorrhage | Warfarin | Dabigatran, 110 mg | 30.15 (20.53, 39.78) | |
| ** Include intracranial haemorrhage and exclude fatal events | |||
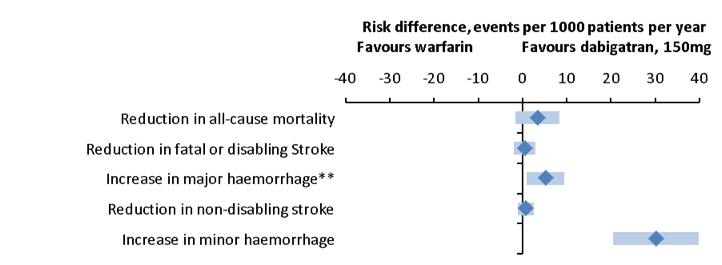
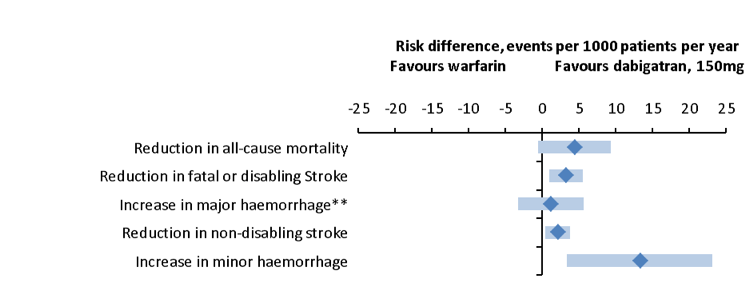
Table 11:Key benefit-risk summary table – warfarin versus dabigatran, 150 mg
| Criteria | Drug | Comparator | Risk Difference per 1000 patients per year (95%CI) |
|---|---|---|---|
Reduction in all-cause mortality | Warfarin | Dabigatran, 150 mg | 4.39 (-0.54, 9.32) | |
Reduction in disabling Stroke | Warfarin | Dabigatran, 150 mg | 3.21 (0.93, 5.50) | |
| Increase in major haemorrhage** | Warfarin | Dabigatran, 150 mg | 1.19 (-3.26, 5.63) |
Reduction in non-disabling stroke | Warfarin | Dabigatran, 150 mg | 2.11 (0.38, 3.83) | |
Increase in minor haemorrhage | Warfarin | Dabigatran, 150 mg | 13.27 (3.39, 23.16) | |
| ** Include intracranial haemorrhage and exclude fatal events | |||
Figure 8: Forest plot illustrating the effect of warfarin versus dabigatran, 110 mg for primary prevention of stroke in patient with atrial fibrillation (** Include intracranial haemorrhage and exclude fatal events).
Figure 9: Forest plot illustrating the effect of warfarin versus dabigatran, 150 mg for primary prevention of stroke in patient with atrial fibrillation (** Include intracranial haemorrhage and exclude fatal events).
Warfarin versus apixaban
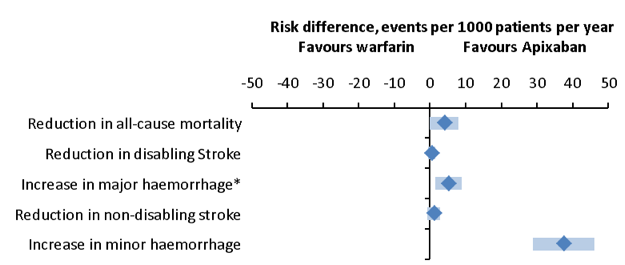
Table 12: Key benefit-risk summary table warfarin versus apixaban primary prevention of stroke in patients with atrial fibrillation
| Criteria | Drug | Comparator | Risk Difference per 1000 patients per year (95%CI) |
|---|---|---|---|
| Reduction in all-cause mortality | Warfarin | Apixaban | 3.97 (-0.07, 8.02) |
| Reduction in disabling Stroke | Warfarin | Apixaban | 0.47 (-0.61, 1.56) |
| Increase in major haemorrhage* | Warfarin | Apixaban | 5.23 (1.55, 8.91) |
| Reduction in non-disabling stroke | Warfarin | Apixaban | 1.07 (-0.71, 2.86) |
| Increase in minor haemorrhage | Warfarin | Apixaban | 37.50 (28.85, 46.15) |
| * Exclude intracranial haemorrhage and include fatal events | |||
Figure 10: Forest plot, risk difference between warfarin and apixaban (* Exclude intracranial haemorrhage and include fatal events
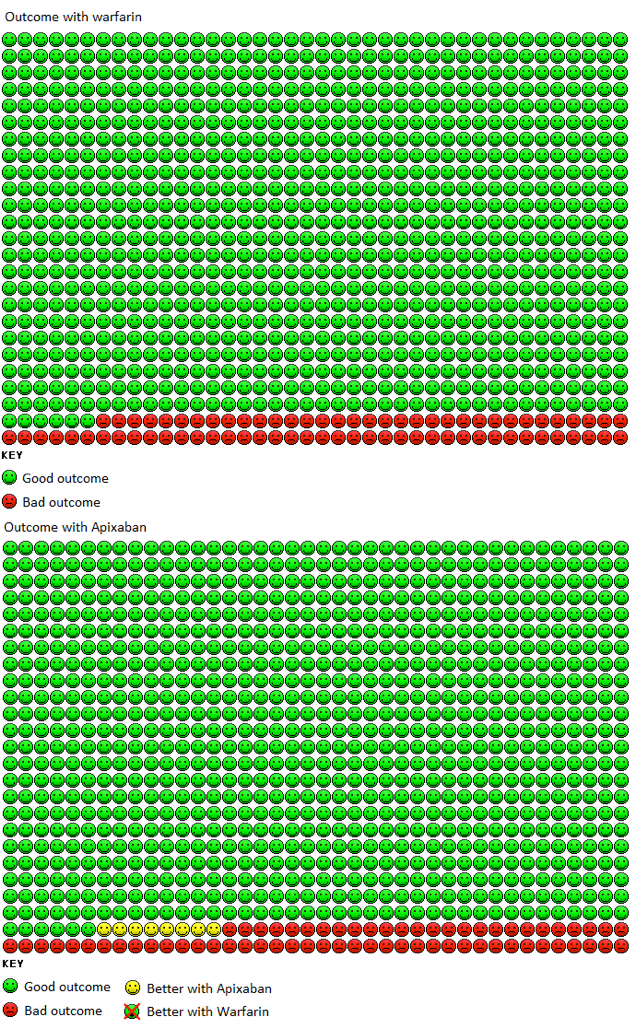
Figure 11:The pictogram represents the performance of warfarin versus apixaban in the indication of atrial fibrillation, on death from any cause. In the Warfarin group 74 patients out of 1000 died from any cause over 1.8 years (95% CI 68,30 - 79,04) compared to 66 patients out of 1000 in the apixaban group (95% CI 61,02 – 71,22)
Warfarin versus riveroxaban
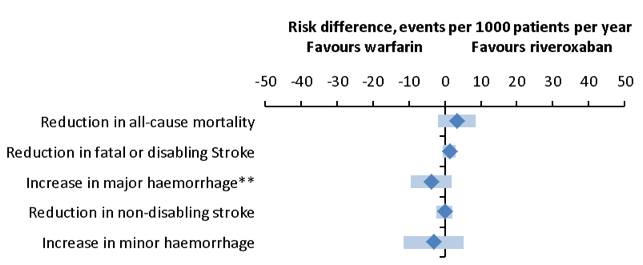
Table 12: Key benefit-risk summary table warfarin versus apixaban primary prevention of stroke in patients with atrial fibrillation
| Criteria | Drug | Comparator | Risk Difference per 1000 patients per year (95%CI) |
|---|---|---|---|
| Reduction in all-cause mortality | Warfarin | Riveroxaban | 3.36 (-1.87, 8.58) |
| Reduction in disabling Stroke | Warfarin | Riveroxaban | 1.22 (-0.51, 2.96) |
| Increase in major haemorrhage** | Warfarin | Riveroxaban | -3.87 (-9.62, 1.87) |
| Reduction in non-disabling stroke | Warfarin | Riveroxaban | -0.11 (-2.40, 2.18) |
| Increase in minor haemorrhage | Warfarin | Riveroxaban | -3.19 (-11.50, 5.13) |
| ** Include intracranial haemorrhage and exclude fatal events | |||
Figure 12: Forest plot warfarin versus riveroxaban (**include intracranial haemorrhage and exclude fatal events).
Comparing warfarin arm of newer RCTs and older RCTs
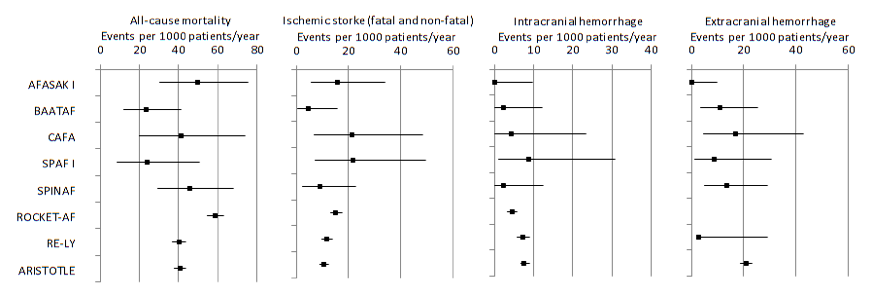
Figure 13: Events per 1000 patient per year from the warfarin arm of five older RTCs and the three newer RTCs.
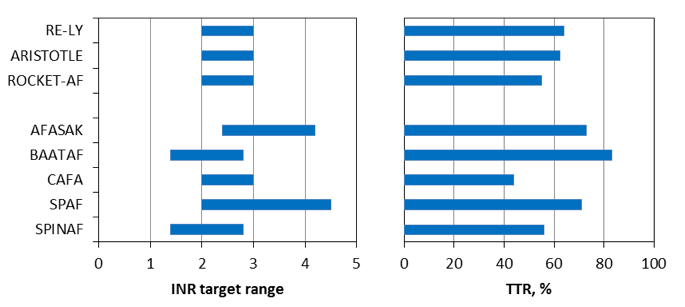
Figure 14: INR target range for the 8 RCTs to the left and time in target range (TTR) to the right.