
Multiple Criteria Decision Analysis (MCDA-Deterministic)
We also applied MCDAto the efalizumab case study.
Decision context
Wesummarised here the process and results of a decision conference on 1 December 2011 whose purpose was to create and explore a model of the benefit-risk balance for the drug efalizumab. The drug received marketing authorisation on 20 September 2004 for the treatment of adult patients with moderate to severe chronic plaque psoriasis who have failed to respond to other systemic therapies. By January 2009 the margin of benefits over risks had narrowed since approval, so the European Commission requested the CHMP to assess the concerns and its impact on the benefit-risk balance for efalizumab, to give its opinion on measures necessary to ensure the safe and effective use of efalizumab, and on whether the marketing authorisation for this product should be maintained, varied, suspended or withdrawn. The Marketing Authorisation Holder (MAH) did not wish to conduct further clinical trials, as the CHMP had required to lift the suspension recommended in February, so in June the European Commission withdrew the marketing authorisation for efalizumab.
This decision conference took the view of regulators in early 2009, when they were assessing the benefit-risk balance in light of the new information received post-authorisation. Two sources of data contributed to the benefit-risk model: the original 2004 EPAR and the PSUR 10 document provided by Merck Serono.PSUR 10 was the last Periodic Safety Update Report submitted to EMA in November 2008 before Market Authorisation suspension in February 2009.
The primary task for the day was to develop a benefit-risk model of efalizumab, assuming a regulator's perspective in early 2009. Team members had assembled the relevant data from the EPAR and PSUR into an extended Effects Table, which summarised the benefit and risk criteria as favourable and unfavourable effects, with their definitions, the relevant patient population from which the data were drawn, the measurement scales associated with the criteria, the units of measurement and the data. The Effects Table was created during the application of the PrOACT-URL framework to the modelling of efalizumab. This pre-work expedited the work of the group in building a model.
1. The Options or alternatives
The group recognised that data were available only for two options:
- 1. efalizumab in 2009 (pre and post-marketing data)
- 2. placebo in 2004 (pre-marketing data)
No data were available for an option discussed at the time both by Regulators and Company, resulting in a limitation of treatment to 2 years.
2. The Criteria
Five favourable effects and ten unfavourable effects characterise the final model. The clinical trials conducted prior to approval provided data for the five favourable effects and for five of the unfavourable effects, while the Merck Serono PSUR 10 document provided data for the other five unfavourable effects. Although the available documentation reports many effects, the group chose to model only those effects that might affect the benefit-risk balance; thus, many unfavourable effects were not included in the model. The Effects Tree, Figure 8, shows favourable and unfavourable effects at the nodes, and criteria against which the drugs are evaluated at the extreme right.
Figure 8: The evaluation criteria organised by Favourable Effects (FE) and Unfavourable Effects (UFE). The weights assigned to Severe Psoriasis and Hypersensitivity Reactions were so small that their cumulative weights are effectively zero, indicated by the dashed lines.
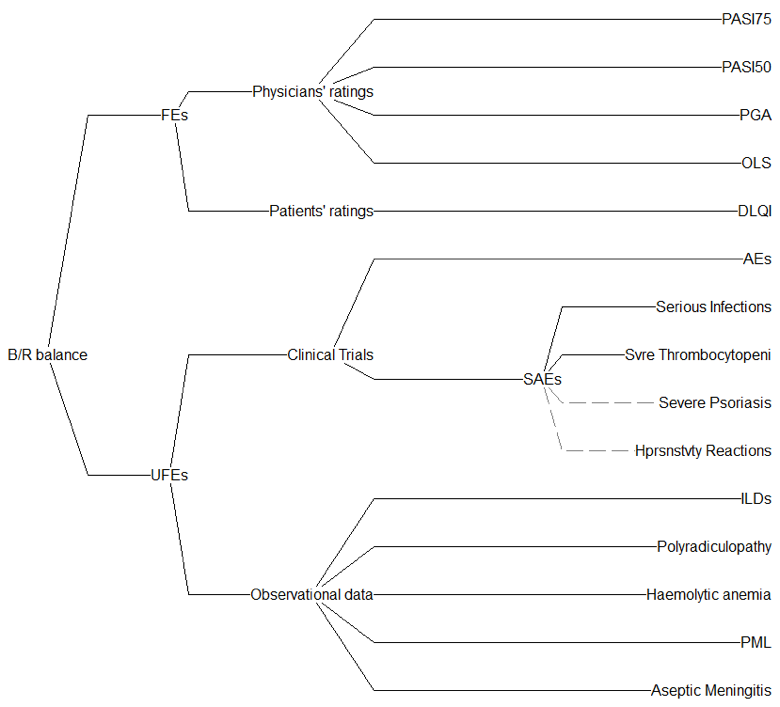
An analysis of the data after the decision conference showed that although Serious Infections and Severe Thrombocytopenia were reported in the PSUR, they were less prevalent than in the clinical trials, where the model showed they had no effect on the benefit-risk balance, so they were not included as relevant criteria for the Observational Data.
Definitions of the criteria are given in Effects Table, Table 8. The table shows the short name given in Figure 8, the description of the effect, which in some cases is further explained in the footnotes, fixed upper and lower values that define a plausible range for the data, the units of measurement, and, finally, the data for efalizumab and the placebo. Data from more than one clinical trial were pooled to give the values shown in the Effects Table.
Table 8: Effects Table for efalizumab.
| Name | Description | Fixed Upper | Fixed Lower | Units | Efalizumab | Placebo | |
|---|---|---|---|---|---|---|---|
Favourable Effects
| PASI75 |
Percentage of patients achieving 75% reduction in baseline PASI at week 12. |
60.0 |
0.0 |
% |
29.5 |
2.7 |
|
| PASI50 | Percentage of patients achieving 50% reduction in baseline PASI at week 12. | 60.0 | 0.0 | % | 54.9 | 16.7 | |
| PGA | Percentage of patients achieving Physician's Global Assessment clear/almost clear at week12. | 40.0 | 0.0 | % | 29.5 | 5.1 | |
| OLS | Percentage of patients with Overall Lesion Severity rating of minimal or clear at FT (day 84). | 40.0 | 0.0 | % | 32.1 | 2.9 | |
| DLQI | Dermatology Life Quality Index. Mean percentage of patients showing an improvement. | 10.0 | 0.0 | Change score | 5.8 | 2.1 | |
Unfavourable Effects
| AEs |
Percentage of patients exhibiting injection site reactions, mild to moderate dose-related acute flu like symptoms. |
50.0 |
20.0 |
%/100ptyrs |
41.0 |
24.0 |
|
| Severe infections | Proportion of patients experiencing infections serious enough to require hospitalisation. | 3.00 | 0.00 | %/100ptyrs | 2.83 | 1.4 | |
| Severe Thrombocytopenia | Number of cases exhibiting severe (grade 3 and above) thrombocytopenia. | 10 | 0 | number | 9 | 0 | |
| Psoriasis Severe Forms | Percentage of patients developing severe forms of psoriasis (erythrodermic, pustular). | 4.0 | 0.0 | % | 3.2 | 1.4 | |
| Hypersensitivity Reactions | Percentage of patients exhibiting hypersensitivity reactions, arthralgia, psoriatic arthritis, flares, back pain asthenia, ALT and Ph. Alk increase. | 10.0 | 0.0 | % | 5.0 | 0 | |
| Intersticial Lung Disease | Number of cases of intersticial lung disease. | 20 | 0 | number | 18 | 0 | |
| Inflammatory Polyradiculopathy | Number of cases of inflammatory polyradiculopathy. | 5 | 0 | Data | 4 | 0 | |
| SAEs | Number of cases of haemolytic anemia. | 25 | 0 | number | 24 | 0 | |
| PML | Number of cases of progressive multifocal leukoencephalopathy. | 5 | 0 | number | 4 | 0 | |
| Aseptic Meningitis | Number of cases of aseptic meningitis. | 30 | 0 | number | 29 | 0 | |
PASI is a measure of the average redness, thickness and scaliness of the lesions (each graded on a 0-4 scale), weighted by the body region and the area affected. PASI range is from 0 to 72. PGA is a seven point scale with 7 being clear, 6 almost clear, 5 mild, 4 mild to moderate, 3 moderate, 2 moderately severe and 1 severe psoriasis. DLQI is a 10-item quality of life index scored by the patient on a four point scale. As shown in laboratory test results that indicate a decrease in number of platelets in a blood specimen. |
|||||||
The Hiview3 (http://www.catalyze.co.uk) computer program converted the scores of the drug and placebo on those measurement scales into 0-100 preference value scales. Either direct linear transformations (higher measures are more preferred) or inverse linear (lower measures are more preferred, as for mean change in PGA score). An exception was PML, for which a non-linear value function was deemed more appropriate over the whole range from 0 to 5 cases per patient year. Participants assessed the value function shown in Figure 9; this effectively captures the non-linear clinical relevance of the number of PML cases.
Weights later assigned to the criteria ensured the equality of units of the preference values on all scales. It is this conversion from different input measures into preference values, whose criterion scales are later weighted, that enable quantitative comparisons of benefits and risks.
It is apparent that some double-counting exists in the favourable effects. The proportion of patients achieving PASI75 is included in the proportion of patients PASI50. The subsequent weighting process took this into account by ensuring that the sum of weights on these two scales considered together was in the desired proportion to the other scales.
Figure 9: The group's assessed value function for number of PML cases.
3. Scoring the Options
Measures expressing the performance of the options on each criterion were determined by the group on the basis of the pooled data, and entered into the computer. An example, PML, is shown in Figure 10. Input data on the left are displayed on the thermometer scale, whose range from 0 to 5 cases encompasses the entire range of uncertainty about this effect. The right panel shows the computer??s inverse linear conversion of those scores onto a 0-100 preference scale.
Figure 10: Input data for the two options on the PML criterion, left panel, and their conversion into preference values, right panel, showing that lower proportions of the AE are more preferred, and that the non-linear value function, shown in Figure 9, substantially increases the difference between the drug and placebo.
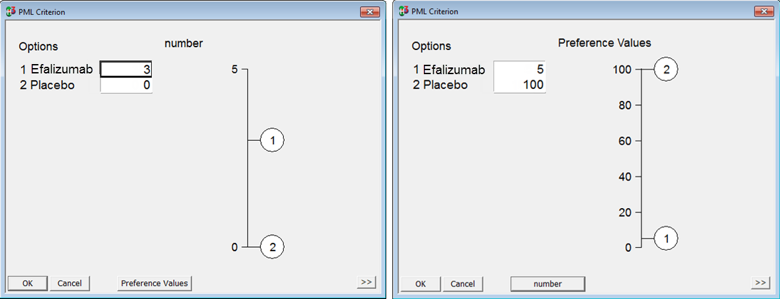
At this stage in the analysis, all input data had been converted into 0-100 preference-value scales. As there are 10 such scales, the next task was to ensure that the units of preference value were equivalent across all the scales. That is the purpose of weighting.
4. Weighting
Some criteria are more clinically relevant expressions of preference value than others. Although that is an intuitively appealing statement, more precision is needed to enable the assessment of weights for the criteria. To ensure that assessed weights are meaningful, the concept of "swing weighting" was applied. As an analogy, both Fahrenheit and Celsius scales contain 0 to 100 portions, but the swing in temperature from 0 to 100 on the Fahrenheit scale is, of course, a smaller swing in temperature than 0 to 100 on a Celsius scale; it takes 5 Celsius units to equal 9 Fahrenheit units. The purpose of weighting in decision theory is to ensure that the units of preference value on the different scales are equivalent, thus enabling weighted scores to be compared and combined across the criteria. Weights are, in essence, scale factors.
It follows, then, that to judge preference value, two steps in thinking must be separated. First, it is necessary to think about the difference in the measured effect represented by a preference value of 0, compared to the level of effect represented by a preference value score of 100. That is a straightforward assessment of a difference in effect, from the least preferred effect to the most preferred effect on that criterion. The next step is to think about how much that difference in effect matters; this is essentially a judgement of the clinical relevance of the difference in effect size. "How big is the difference and how much do you care about that difference?" This is the question that was posed in comparing the 0-to-100 swing in effect on one scale with the 0-to-100 swing on another scale.
During the decision conference participants first assessed weights within each right-most grouping of favourable effects, the four Physicians' ratings criteria first. Figure 11 shows the weights for those that grouping. The group agreed that the swing from 0% to 100% on the PASI75 scale was better than any of the other three 0% to 100% improvements, so the PASI75 was assigned a weight of 100. Compared to that, the group judged the swing on the PGA scale to be nearly as good, and agreed a weight of 80
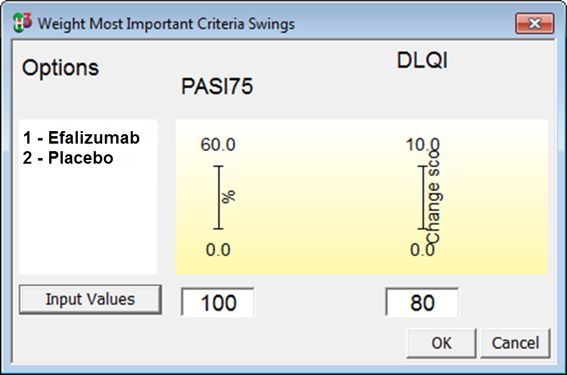
Figure 11: The swing-weights assigned to the four Physicians' ratings scales.Figure 12: Swing weights assigned to the 100-weighted criteria for PASI75 and PGA
In the next step, the group compared the PASI75 scale with the DLQI scale, assigning the latter a weight of 80 compared to the PASI75, as shown in Figure 12.
The group then turned to weighting the Unfavourable Effect criteria, starting with the SAE criteria; the largest swing weight was judged to be for Serious Infections, so that criterion was given a weight of 100. Next, that criterion was compared to AE, which was assigned a weight of 20. Then, moving to the criteria under Observational data, the group quickly agreed that the 0-to-5 swing for PML was the most important, so it was given a weight of 100, and the other swings were judged relative to that 100. Comparing the 100-rated swing under Clinical Trials, Serious Infections, with the 100-rated swing under Observational data, PML, resulted in an assessed weight of 20 for Serious Infections compared to the 100 for PML.
The final, and most difficult comparison, is shown in Figure 13: PASI75 versus PML. After considerable debate, the group agreed that the PML swing, from 5 cases down to none, was half the clinical relevance of PASI75, from 0% to 60% of patients achieving PASI75. But sensitivity analysis on that weight was promised, for not everybody agreed that 2 to 1 was the final answer.
Figure 13: Swing weights comparing PASI75 to PML.
This process compares swings from the least to the most preferred positions on the criteria associated with a node. We assigned one criterion a weight of 100, and then compared the 100-weighted criterionto others.This ensures the comparability and consistency of the units of preference values across all criteria.
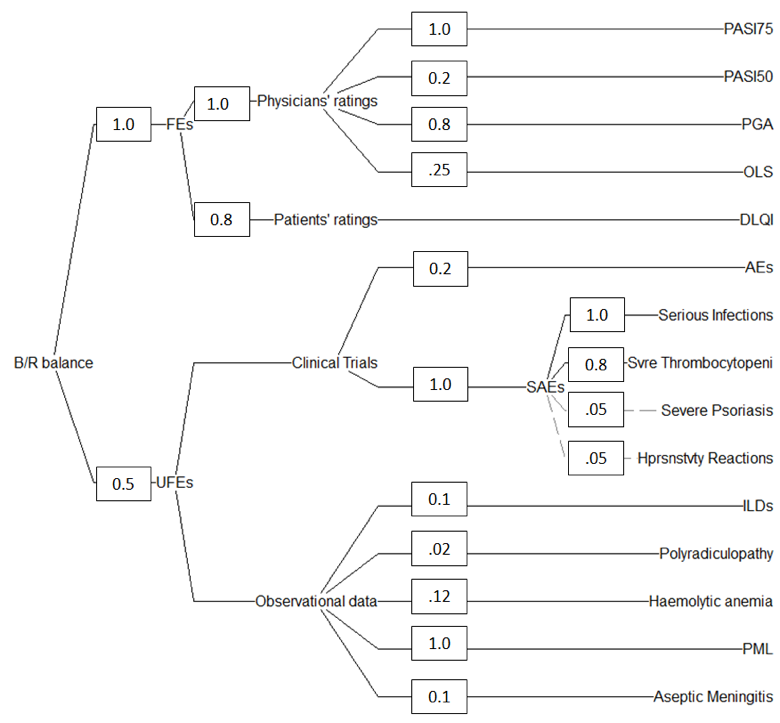
It is easy to become lost in attempting to understand the weighting process by reading about it, so Figure 14 shows all the originally-assessed weights, each divided by 100, on the value tree. Hiview3 multiplies these weights along each path through the tree, sums the products for all 11 criteria and divides each product by the sum. This gives the cumulative weights shown in Figure 10, re-normalised to 100, with the criteria sorted in order of the cumulative weights.
It is important to keep in mind that a cumulative weight represents the total added preference value in moving from the least to most preferred positions on a scale. These weights represent the relative importance of the 0-100 preference value ranges on the scales, not the relative importance of favourable and unfavourable effects, and particularly not the relative importance of those effects for the drug and placebo. By summing cumulative weights, it is possible to see the weights at each node. For example, the sum of all the favourable effects weights is 78 with 22 for the unfavourable effects. In other words, the total range of 0-100 differences in preference values on the favourable effects three-and-a-half times the range of that on the unfavourable effects.
Figure 14: The originally-assessed swing-weights, divided by 100, assigned at all the nodes.
Remarks
Modelling efalizumab at this point in time, two years after the drug was withdrawn, proved to be difficult because the judgements made in 2009 by the assessors and regulators are not recoverable. It is not even possible to know precisely what data led regulators to their decision, for none of the public documents, from 2004 onward, are clear about which criteria the assessors considered relevant to the benefit-risk balance, and which were not. So, though it was possible to model efalizumab retrospectively, the model developed here may well be an incomplete representation of all the explicit and implicit considerations assessors brought to bear at the time the assessment reports were written.