
BRAT Framework
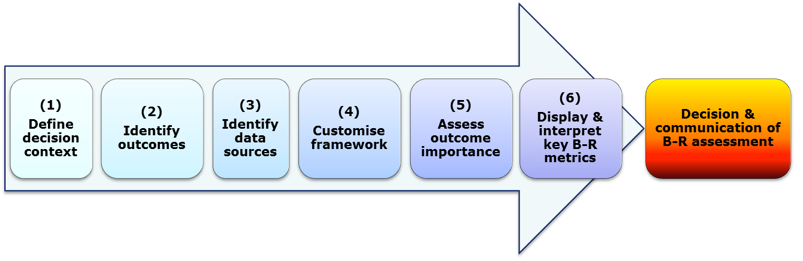
The 6 steps of the BRAT frameworkare shown below:
The actual decision and defense of the B/R decision is taken outside of the 6 step framework. This speaks to the medical judgment that must be integrated at the end of the day to any quantitative activity in order to capture the clinical meaningfulness of the issue at hand. The framework does not issue a decision itself in the form of an integrated B-R summary statistic resulting from the execution of the 6 step process.
The BRAT framework and its modified application in the efalizumab case study is described below.
1. Decision context
| Indication | Efalizumab is indicated in the treatment of "high need" adult patients with moderate to severe chronic plaque psoriasis who have failed to respond to, or who have a contraindication to, or are intolerant to other systemic therapies including cyclosporine, methotrexate and PUVA. The duration of initial therapy is 12 weeks. Therapy may be continued only in patients who responded to treatment (PGA good or better). |
| Drug | Raptiva (efalizumab) is a recombinant, humanized IgG1 monoclonal antibody that targets CD11a, the α-subunit of leukocyte function associated antigen 1 (LFA-1). Mechanism of action may lead to inhibition of leukocyte migration, similarly to natalizumab.) |
| Formulation/Dose | An initial single dose of 0.7 mg/kg body weight is given followed by weekly injections of 1.0 mg/kg body weight, subcutaneously |
| Comparator | placebo only |
| Population | "high need" adult patients with moderate to severe chronic plaque psoriasis who have failed to respond to, or who have a contraindication to, or are intolerant to other systemic therapies |
| Time Frame for Outcomes | 12 weeks for PASI 75 (efficacy/favourable effects), 3 years for PML |
| Perspective | Regulator (at EMA) |
For comparators, consideration was given to methotrexate, cyclosporine and PUVA (available non-biologic therapies at time of initial approval, and also alternative biological therapies (etanercept, infliximab, adalimumab) which became available for the treatment of moderate to severe plaque psoriasis in "high need" patients in the subsequent months after initial approval: however due to time limitations and challenges with data transformation, the comparison was limited to placebo.
2.Identify outcomes
The criteria most likely to influence the benefit-risk balance were discussed and selected following team meetings representing several areas of expertise (clinical, regulatory, biostatistical and modelling). The main source document was the 2009 SPC of efalizumab and the last PSUR (No 10).
For the efalizumab case example, the historical regulatory scenario and decision context specified in Step 1 placed limitations on how step 2 of the PhRMA BRAT framework could be adopted. Firstly, the perspective of the regulator would have been informed by the favourable and unfavourable effects data provided via clinical trials and post-marketing surveillance. This information was documented in regulatory documents such as EPAR, Scientific Discussion, and changes to the Summary of Product Characteristics (SPC). Therefore the taskforce did not obtain a pool of outcomes from literature reviews, regulatory precedents and meetings with clinical experts as suggested by the PhRMA BRAT method. Instead, regulatory documents were closely examined to specifically address how the regulator would have considered the benefit risk balance with the data which would have been available to them at the time.
Secondly, the PhRMA BRAT framework suggests listing known or potential outcomes relevant to public health, physicians, and patients. This can result in the inclusion of outcomes deemed important by specific stakeholder groups. However, our taskforce refrained from this as we wanted the perspective to be specific to only the regulator and the data they could have accessed at the time of decision-making. This is a traditional perspective, although it is worth noting that explicitly discussing the outcomes for inclusion between stakeholders can result in a beneficial harmonisation between groups.
Thirdly, the data broadly addressed the outcome of "favourable effects" in terms of efficacy with "unfavourable effects" in terms of safety. The taskforce had previously compiled data contained within the regulatory documents into an Effects Table. However, it became evident that information compiled within effects table placed a primary emphasis on measures rather than outcomes. That is, the data presented to the regulator was often in terms of measures e.g. PASI75, PGA etc., which was then broadly covered with either an umbrella outcome term of "efficacy", or one of "safety". Therefore, we did not perform the suggested task of selecting measures to characterise outcomes, as we had already collected measures of relevance to our scenario
Table 1: Measures most likely to importantly influence the benefit-risk balance |
Favorable effects:PASI75 PGA OLS DLQI PASI50 Unfavourable effects:ADR1 (mild to moderate ADRs as documented in the SPC) ADR2 (serious ADRs) Meningitis aseptic Serious infections including pneumonia, sepsis, cellulitis Opportunistic infections including fungal infections, tuberculosis, herpes virus infections, EBV, CMV Serious thrombocytopenia Immune haemolyticanaemia Psoriasis severe forms (erythrodermic, pustular) Nervous System disorders including Inflammatory polyradiculopathy, Facial Palsy, Guillain-BarreSyndrome, Fisher Miller Syndrome Interstitial lung diseases including lung infiltration, pulmonary fibrosis Serious cases of psoriasis exacerbation or rebound Brain infections including Encephalitis and PML |
The framework distinguishes between measures which count outcome events and count patients. It is important to note that for each measure within this case study the units varied for the clinical trial and surveillance data presented within regulatory documents. Therefore, there was an extremely mixed approach to units in the case study, ranging from percent per 100 patient years, to number of cases, to percent. The measures also vary with different time periods and populations.
Composite measures are frequently reported in regulatory documents. Although the framework acknowledges composite measures to be useful when one outcome may not adequately capture the most relevant attribute for a product, it warns that it might introduce difficulty when making important trade-offs in Step 5 of the PhRMA BRAT framework, especially if the outcomes it contains have different effects on patients. Measures are frequently placed together into composite groups within the effects table.
In an unmodified application of the BRAT framework, the tree would exclude outcomes which are considered components of another included outcome, and outcomes which are similar to prevent double counting and overestimation of effects. Our methods deliberately diverged from the method at this point to include all potential outcomes and disregard double counting and overestimation. This was because from a clinical perspective, the larger efalizumab team believed in the importance of measures such as the PASI 75 and PASI 50 for example, (although recognizing that it could be contentious, from the perspective of double counting). This allowed for a full comparison of measures to examine how the visual representation (benefit risk summary table or forest plot) of similar measures may vary.
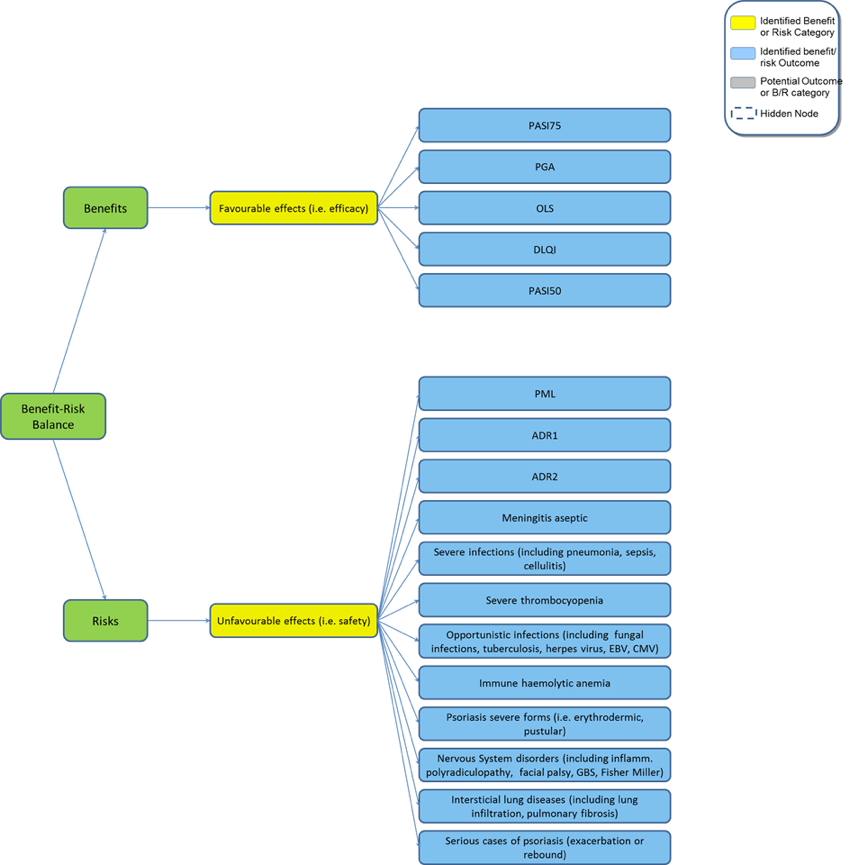
It was possible to draw up an initial value tree which contained the benefit and risk measures from Table 1. This tree was further developed in the subsequent steps to only include available, precisely defined, reliable and accurate end-point measures available to the regulator at time of decision-making.
Figure 1: Initial value tree built using BRAT framework tool (modified)
3. Identify and extract source data
The sources of evidence to extract relevant data from are European Public Assessment Reports (EPAR), the EU SPC, and data extracted from the last PSUR of the drug before Market Authorisation suspension, for quantification of spontaneously reported Adverse Effects.
The time horizon for the decision was mainly supported by 12 weeks pivotal Clinical Trials, and some additional longer term efficacy data from Follow-up studies (non comparative, non randomised) for the Favourable Effects. The time horizon for Unfavourable Effects consisted in the safety data from the above mentioned Clinical Trials, and all available post-marketing data until Market Authorisation suspension (i.e. 5 post-marketing years)
Rationale for inclusion or exclusion of data was documented (table 2). Specifically, measures were only included if they had sufficient information to complete the required data source table fields in Step 4, e.g. background epidemiology of placebo known.
| Table 2: Measures and inclusion | |||
Measure | Source | Inclusion | Rationale | |
| PASI75 | Clinical trials | Yes | Complete data |
| PGA | Clinical trials | Yes | Complete data |
| OLS | Clinical trials | Yes | Complete data |
| DLQI | Clinical trials | No | Average and standard deviation missing |
| PASI 50 | Clinical trials | Yes | Complete data |
| ADR1 (Percentage of patients exhibiting injection site reactions, mild to moderate dose-related acute flu like symptoms) | Clinical trials(ISS) | Yes | Complete data |
| ADR2 (Proportion of patients experiencing infections serious enough to require hospitalisation) | Clinical trials(ISS) | No | Percentage of events in placebo group not given; percentage of events for efalizumab not precise (range given) |
| Meningitis aseptic | PSUR10 | No | Background epidemiology not known |
| Serious infections including pneumonia, sepsis, cellulitis | Clinical Trials (ISS) | Yes | Complete data |
| Opportunistic infections including fungal infections, tuberculosis, herpes virus infections, EBV, CMV | PSUR10 | No | RMP only states background epidemiology of tuberculosis; background epidemiology of other conditions not known |
Serious thrombo cytopenia | PSUR10 | No | Background epidemiology not known |
| Immune haemolytic anemia | PSUR10 | No | Background epidemiology not known |
Psoriasis severe forms (i.e. erythrodermic, pustular) | Clinical Trials (ISS) | Yes | Complete data |
| Nervous System disorders including Inflammatory polyradiculopathy, Facial Palsy, GBS, Fisher Miller syndrome | PSUR10 | No | Background epidemiology not known |
| Interstitial lung diseases including lung infiltration, pulmonary fibrosis | PSUR10 | No | Background epidemiology not known |
| Serious cases of psoriasis exacerbation or rebound | PSUR10 | No | Background epidemiology not known |
| Brain infections including Encephalitis and PML | PSUR10 | Yes | Complete data |
4. Customize the framework
Step four customises the framework. The initial value tree created in step two is modified to account for clinical expertise and the data reviewed in step three. Outcomes considered irrelevant to the benefit- risk assessment or stakeholder groups are either refined to obtain relevance or removed.
For our case study, we were constrained by the quality of data sources. Measures with incomplete data (e.g. no details on background epidemiology) were removed. Table 3 lists the final outcome measures used.
| Table 3: Final list of outcome measures | |
| PASI75 | Proportion of patients who achieve a 75% reduction in PASI scores. The PASI score is derived by evaluating erythema, scaling and thickness and then weighting the coverage according to the area covered, i.e. head, trunk, upper extremities and lower extremities. The scores can range from 0 (least severe) to 72 (most severe). |
| PASI50 | Proportion of patients who achieve a 50% reduction in PASI scores after two weeks. See PASI75 scoring of the PASI. |
| PGA | Static PGA is a measure of the psoriatic lesions taken at a single time point. The scores can range from 7 (least severe) to 1 (most severe). |
| OLS | The OLS is a global rating of psoriasis severity according to plaque elevation, scaling, and erythema at a given time point. The scores can range from 0 (least severe) to 5 (most severe). |
| PML | Progressive multifocal leukoencephalopathy. A demyelinating disease caused by reactivation of the John Cunningham virus. |
| ADR1 | Mild to moderate dose related acute flu-like symptoms. Injection site reactions |
| Psoriasis severe forms | E.g. erythrodermic, pustular |
Customising the value tree
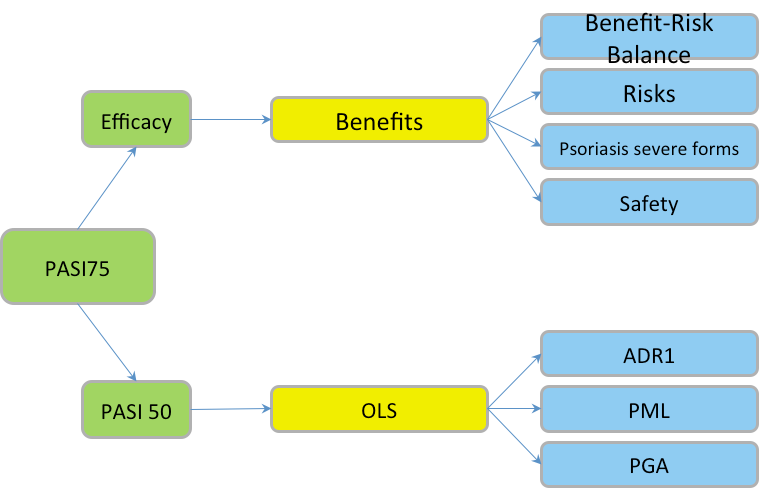
The corresponding Value Tree was customised accordingly:
Figure 2: Customised Value Tree efalizumab
Data source table
The PhRMA BRAT guidelines state that a data source table should be completed, which includes all study and publication details. Such a table would ideally store sufficient information and relevant metrics to enable a full and articulate discussion of benefit-risk while providing complete transparency into the origin and format of the source data. The visualisations software which was provided to users of the BRAT framework is an Excel based application that does not have the capacity to store information on the data sources, and instead contains a spreadsheet to store details of the measures (table 4).
| Table 4: Data table | ||||||
Outcome name | Treatment 1 rate point estimate | Treatment 1 rate lower CI | Treatment 1 rate upper CI | Treatment 1 number of patients | Treatment 1 number of events | Duration treatment 1 | |
| PASI75 | 0.28 | 0.18 | 0.41 | 1742 | 485 | 12 |
| PGA | 0.3 | 0.18 | 0.46 | 1742 | 531 | 12 |
| OLS | 0.29 | 0.18 | 0.44 | 1742 | 508 | 12 |
| PML | 8.51 10-5 | 1.72 10-6 | 1.69 10-4 | 47000 | 4 | PMS |
| ADR1 | 0.41 | 0.39 | 0.43 | 1742 | 714 | 12 |
| Psoriasis severe forms | 0.03 | 0.02 | 0.04 | 1742 | 56 | 12 |
Outcome name | Treatment 2 rate point estimate | Treatment 2 rate lower CI | Treatment 2 rate upper CI | Treatment 2 number of patients | Treatment 2 number of events | Duration treatment 2 | |
| PASI75 | 0.04 | 0.02 | 0.06 | 979 | 36 | 12 |
| PGA | 0.05 | 0.03 | 0.09 | 979 | 51 | 12 |
| OLS | 0.04 | 0.02 | 0.06 | 979 | 36 | 12 |
| PML | 4.40 10-6 | 3.10 10-6 | 5.70 10-6 | 10000000 | 44 | PMS |
| ADR1 | 0.24 | 0.21 | 0.27 | 979 | 235 | 12 |
| Psoriasis severe forms | 0.01 | 0.01 | 0.02 | 979 | 14 | 12 |
Outcome name | Risk difference point estimate | Risk difference lower CI | Risk difference upper CI | Relative risk point estimate | Relative risk lower CI | Relative risk upper CI | |
| PASI75 | 0.24 | 0.15 | 0.36 | 7.82 | 5 | 12.38 |
| PGA | 0.25 | 0.14 | 0.4 | 5.78 | 3.6 | 9.34 |
| OLS | 0.25 | 0.15 | 0.39 | 7.81 | 4.73 | 13.27 |
| PML | 8.07 10-5 | -2.70 10-6 | 1.64 10-4 | 19.34 | 6.95 | 53.83 |
| ADR1 | 0.17 | 0.13 | 0.21 | 1.71 | 1.51 | 1.93 |
| Psoriasis severe forms | 0.02 | 0.01 | 0.03 | 2.25 | 1.26 | 4.02 |
BRAT Framework
The 6 steps of the BRAT frameworkare shown below:
Creation of the summary tables and graphs, by definition, requires summarizing the benefit / risk outcome (favourable/unfavourable effects) data across multiple studies. There is a wide range of units of measure for individual study results that may be entered into the framework including absolute risk difference, relative risk, odds ratio, incidence, adjusted relative risk, and time to onset.
For efalizumab, with the data available for each measure as described in the pertinent regulatory documents, 95% confidence intervals, point estimates, risk differences, and relative risks were calculated using the formulae listed in Table 5. Additional data transformation included a Bayesian mixed effects meta-analysis performed for PASI75, PGA and OLS.
The challenge of adequately representing a rare event in the post marketing setting in a manner that translates to the other effect measures, is seen with PML. As we would expect with such small numbers, the relative risk metric is significant but with some uncertainty as evidenced by the wide confidence interval. This metric also bears the statistical assumption that there is a consistent rate of PML across time that may not be true for PML in this patient population.
| Table 5: Definitions and equations used within the data source table | ||
Column | Description | Formula | |
| Outcome | Outcome of interest | |
| Study | Name/code of study | |
| Treatment 1 rate point estimate( | Probability of having an event in the efalizumab arm of the trial | |
| Treatment 1 rate lower/upper CI | Gives the upper and lower confidence intervals of the treatment rate point estimate for efalizumab arm | |
| Treatment 1 number of patients( | Number of patient in the efalizumab arm | |
| Treatment 1 number of events( | Number of events of specified outcome | |
| Treatment 2 rate point estimate ( | Probability of having an event in the Placebo arm of the trial | |
| Treatment 1 rate lower/upper CI | Gives the upper and lower confidence intervals of the treatment rate point estimate for Placebo arm | |
| Treatment 1 number of patients( | Number of patient in the Placebo arm | |
| Treatment 1 number of events(ev) | Number of events of specified outcome | |
| Risk difference point estimate (RDiff) | Difference in risk of having specified event between efalizumab arm and Placebo arm | |
| Risk difference lower/upper CI | Gives the upper and lower confidence interval of the risk difference point estimate | |
| Relative risk point estimate (RR) | Is the relative risk of developing specified outcome in the efalizumab arm when compared to the placebo Arm | |
| Relative risk lower/upper CI | Gives the upper and lower confidence interval of the relative risk point estimate | |
5. Assess outcome importance
In this step, outcomes are assessed for their importance to the decision-maker and other stakeholders, and the subsequent rankings and weightings are applied to the decision tree. Whenoutcomes are differentially weighed relative to one another, it allows for a transparent discussion on priorities between different stakeholder groups and can provide the basis for a sensitivity analysis over the different perspectives. It is important to note that the PhRMA BRAT framework does not advocate a specific method to weigh the preferences of outcomes in the value tree, or require the use of weights at all.
For the purposes of the efalizumab case study, and in the context of PhRMA BRAT framework, it was decided not to formally weight the outcomes by simulating the regulators perspective on prioritization. The efalizumab BRAT sub-team elected to use the summary data visualisations unadjusted for outcome weightings, to consider the benefit risk balance (having selected the outcomes most likely to influence the benefit risk determination, outcomes which were in turn supported by appropriate data).
6. Step 6: Display and interpret key benefit and risk metrics
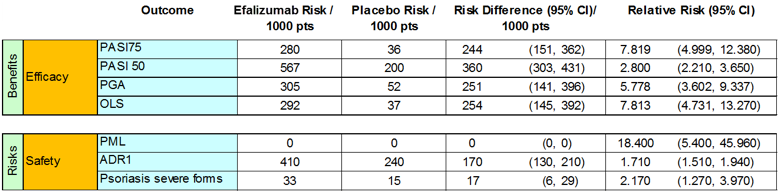
Table 6 places the source data into a key benefit¨Crisk summary table which summarises the key information in source data required to quantify outcomes in the value tree. The table aids interpretation of benefits and risks. The use of such a framework can increase the transparency, predictability and consistency with which benefit-risk assessments are conducted.
Table 6: Key benefit-risk summary table
The PhRMA BRAT framework delivers two comprehensivevisualisations: the key benefit-risk summary table and forest plot. These provide easily interpretable information to stakeholder groups-such as patients and healthcare professionals, enabling them to make informed decisions based on their own preferences. Use of colour-coding throughout the graphs and tables is effective in differentiating among types of data (e.g., benefits vs. risks), and for highlighting certain results. Tables and graphs that seem to communicate effectively are those that display a fairly limited number of data columns, e.g., 5-6. Depending on the audience, interpreting odds ratios and 95% confidence intervals can also be challenging.
Forest plot
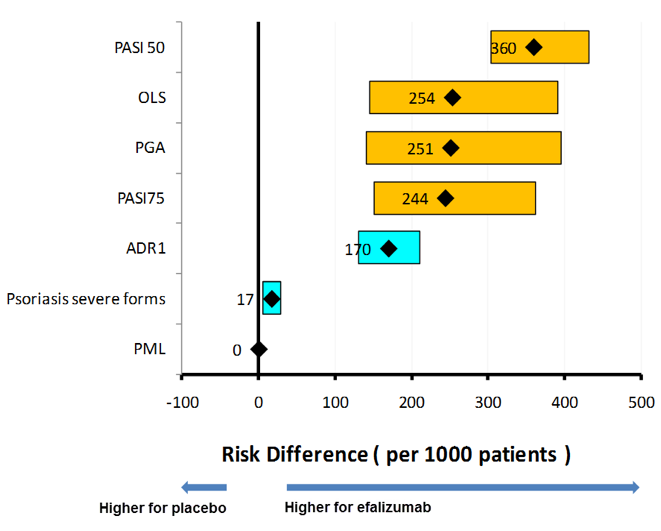
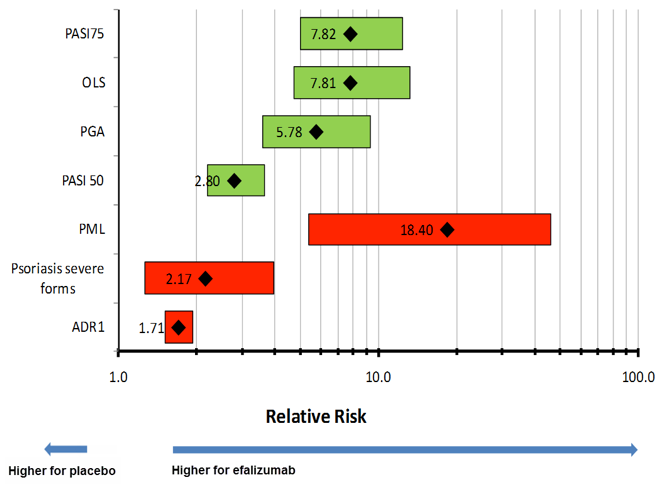
The forest plot records all of the measures on a standardised scale, allowing for the evaluation of each measure relative to other measures. Below are two forest plots comparing efalizumab with placebo, firstly with risk differences for the selected benefit risk outcome measures and secondly with relative risk for the same outcome measures.
Figure 3: Forest plot : Risk difference for key favorable and unfavorable effects (efalizumab compared to placebo)
Figure 4: Forest plot: Relative Risk for key favorable and unfavorable effects (efalizumab compared to placebo)
Discussion: (Decision and)Communication of benefit-risk assessment
The summary information, (both the key benefit risk summary table and forest plots) will lead individuals to draw different conclusions from the same data.
In January 2009, when the Regulators at the EMA were considering if there were any risk minimisation measures which could be rapidly implemented, to maintain a positive B-R balance for efalizumab and this avoid Market Authorisation suspension, a structured approach to a benefit/risk analysis applying the PhRMA BRAT framework on the data available to them, would have yielded the above visualisations.
Looking at the modest efficacy in terms of the differences in risk or relative risk between efalizumab and placebo for the key outcomes, and considering this in the context of the risk of PML and other unfavourable effects such as rebound psoriasis, the regulators would be thinking about the population of adult patients with moderate to severe chronic plaque psoriasis who have failed to respond to, or who have a contraindication to, or are intolerant to other systemic therapies, knowing that there are now alternative biological therapies available to treat the same condition, therapies which have a better defined safety profile by virtue of the incremental exposure resulting from additional indications.
The efalizumab BRAT sub team, when considering the totality of data (including the unfavourable effects such as opportunistic infections, other serious infections, serious thrombocytopenia, and some nervous system disorders which were removed at step 4 of the PhRMA BRAT framework process because of lack of data for placebo), determined that in the end the decision really rested on the trade-off between the benefits of a PASI 75 effect and the unfavourable effect of PML. Instinctively we would have voted for market authorization suspension in the absence of robust mitigation measures for PML.
This Implicit \"trade off\" between PASI 75 and PML provoked the conduction of an additional structured methodology, the benefit risk ratio (BRR).