
PrOACT-URL / Multi-Criteria Decision Analysis
Creating a quantitative model requires a qualitative framework outlining the steps that guide the process. The facilitator applied the PrOACT-URL framework, which specifies eight steps to be considered in making any decision. These are the steps, modified for assessing the benefit-risk balance of a medicinal product (ref: EMA WP 4 report):
| Step | Description |
|---|---|
| Problem | Determine the nature of the problem and its context. |
| Objectives | Establish objectives and criteria of favourable and unfavourable effects. |
| Alternatives | Identify options to be evaluated against the criteria. |
| Consequences | Describe magnitudes and incidence of all effects; create Effects Table. |
| Trade-Offs | Assess criterion weights and establish benefit-risk balance. |
| Uncertainty | Consider how uncertainty affects benefit-risk balance. |
| Risk Attitude | Indicate how assessors' attitudes toward risk affect the benefit-risk balance. |
| Linked Decisions | Consider consistency of decision against similar past and future decisions. |
The quantitative model, MCDA (multi-criteria decision analysis), is an extension of decision theory that applies to decisions with multiple objectives (Chapter 6 of MCA manual). It takes any input data and converts it into a common unit of preference value (or utility). As applied to drugs, the resulting weighted preference values take into account both the data and judgements of the clinical relevance of the data (Drug Discovery Today-Technologies paper and Chapter 5 of Benefit-Risk Assessment in Pharmaceutical Research and Development). See also Case Studies.
Results
The results of the two facilitated workshops and the probabilistic simulation that followed are described for each of the PrOACT-URL steps. One step has been added, Benefit-Risk Balance, which captures the point at which results of applying the other steps can be displayed graphically.
Problem
The problem facing the group was to see if they could develop a quantitative model to explore the benefit-risk balance of rosiglitazone used in combination with metformin. The group considered the history and background of the drug in more detail than given here on the Context page, and discussed the availability of data about its use. Both publicly accessible clinical trial data and post-marketing data were considered.
Objectives
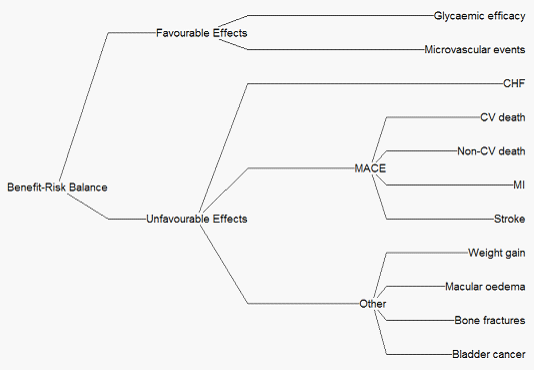
Two favourable effects and nine unfavourable effects characterised the final model. The Effects Tree, Figure 1 below, shows favourable and unfavourable effects at the nodes, and criteria against which the drugs were evaluated at the extreme right. The MACE (Major Cardiac Event) criteria show post-marketing criteria, whereas data drawn mostly from prior-approval clinical trials are shown as Other criteria.
Figure 1 Effects tree
Alternatives
In the first workshop considerable discussion attended the task of identifying the alternatives to be compared, as rosiglitazone had been approved in the UK and USA to be used as a monotherapy, or in combination with metformin or glimepiride, or in triple therapy with metformin and sulphonylurea. Studies have also compared rosiglitazone to pioglitazone. However two different interpretations of the microvascular event data for pioglitazone could not be resolved, so the group agreed to consider just two alternatives:
- 1.Rosiglitazone in a fixed dose combination therapy with metformin, and/or glimepiride, referred to as rosi + adjunct in this document
- 2.Metformin alone, referred to here as an adjunct.
Consequences
The Effects Table gives the definitions of the criteria, two points on the measurement scales chosen to include the range of feasible data, the units of measurement and the pooled data for the two alternatives.
Table 1 Effects table
| Name | Description | Fixed Upper | Fixed Lower | Units | Rosi + adjunct | Adjunct only | ||
|---|---|---|---|---|---|---|---|---|
| Fav'ble Effects | Glycaemic efficacy | (A surrogate marker of the quality of glucose regulation.) Mean change from baseline in the proportion of Hb in which A1c is greater than 48 mmol/ml. | 5.00 | -5.00 | % | -1.18 | 0.06 | |
| Micro-vascular events | Incidence of new cases of microvascular events compared to baseline (Retinopathy requiring photocoagulation, vitreous haemorrhage, & fatal or non-fatal renal failure.) | 20.00 | 0.00 | % | 2.70 | 3.50 | ||
| Unfavourable Effects | CHF | Proportion of patients experiencing congestive heart failure during the study period. | 4.00 | 0.00 | % | 3.69 | 1.89 | |
| MACE | CV death | The proportion of patients who died from any cardiovascular event including stroke. | 4.00 | 0.00 | % | 2.70 | 3.19 | |
| Non-CV death | The proportion of patients who died from any non-cardiovascular event including stroke. | 4.00 | 0.00 | % | 2.97 | 3.86 | ||
| MI | Proportion of patients who experience a non-fatal heart attack. | 5.00 | 0.00 | % | 3.33 | 3.01 | ||
| Stroke | Proportion of patients who experience a non-fatal ischemia stroke. | 5.00 | 0.00 | % | 1.94 | 2.83 | ||
| Other | Weight gain | Mean change from baseline in weight gain at 1 yr. | 10.00 | -5.00 | Kg | 3.80 | 0 | |
| Macular oedema | Proportion of patients who experience macular oedema. | 10.00 | 0.00 | % | 1.27 | 0.23 | ||
| Bone fractures | Proportion of patients experiencing bone fractures. | 3 | 0 | % | 8.33 | 5.3 | ||
| Bladder cancer | Proportion of patients contracting bladder cancer. | 1.00 | 0.00 | % | 0.27 | 0.22 |
The Effects Table provides a summary of those data taken into account in assessing the benefit-risk balance. However, the therapeutic relevance of the data is represented by value functions judged by the group. A value function transforms all input data into 0-100 scales, which represent extent of clinical relevance. Two points define the scale (as two point define a Celsius scale of temperature): 100 is given to the fixed upper value, zero to the fixed lower value. Values at any other points are assigned to represent the clinical relevance of the data.
The data for both favourable effects, each measured in percentages of people, were assigned as direct linear functions (each person contributes the same increment of therapeutic relevance) while indirect linear functions were agreed for the unfavourable effects measured in percentages (each person contributes the same increment of undesirability). Later, in sensitivity analysis, non-linear functions were considered for CHF and Non-CV deaths. With these functions, all input data, whatever their units, were converted into preference values.
Trade-Offs
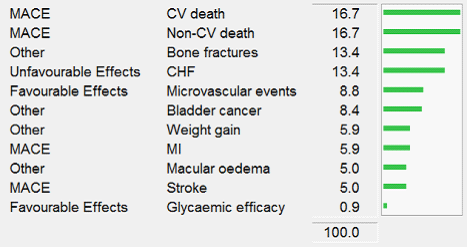
'Swing-weighting' established the clinical relevance of the criteria, thereby providing weights to be applied to the preference values (). The key question put to participants was "How big is the difference between the fixed upper and lower positions on the measurement scale, and how clinically relevant is that difference?" Asking that question in comparing criteria under a node with each other, and then asking again in making comparisons across nodes, resulted in the following weights (Figure 2), which represent the 0-to-100 differences in preference values, not the effects' importance:
Figure 2 Weights
Benefit-Risk Balance
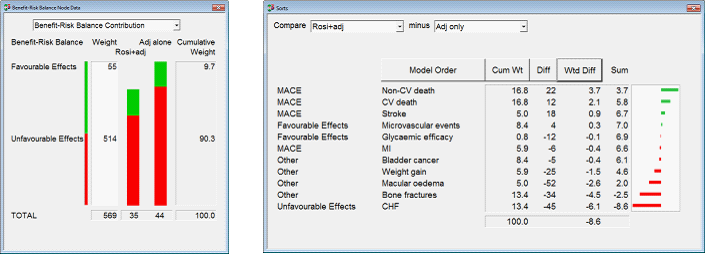
Multiplying preference values by criterion weights and summing the products separately for the two options gives the overall weighted preference values for the two alternatives, shown in the left figure: a 9-point advantage to adjunct alone. Longer green bars mean more benefit, and longer red bars represent more safety. Favourable effects, the upper green bars, show slightly more effectiveness from adding the drug to the adjunct, but the shorter red bar of rosiglitazone + adjunct indicates substantial extra risk. The Cumulative Weight column gives the sums of the weights on the FE and UFE criteria separately: favourable effects weighted about one-tenth as much as unfavourable effects.
The right figure shows rosiglitazone plus adjunct compared to the adjunct only (Figure 3). Green bars favour rosiglitazone plus adjunct: it is preferred to the adjunct only on three MACE effects, with a tiny advantage on Microvascular events, for a total weighted score of 7.0 (shown in the Sum column). But that seven-point advantage is outweighed by the total weighted difference scores on the Other unfavourable effects, shown by the red bars, particularly by CHF. The sum of all 11 weighted differences, -8.6, explains the 9-point difference seen in the totals under the bar chart.
Figure 3 Benefit-risk balance contribution
Uncertainty-sensitivity analysis
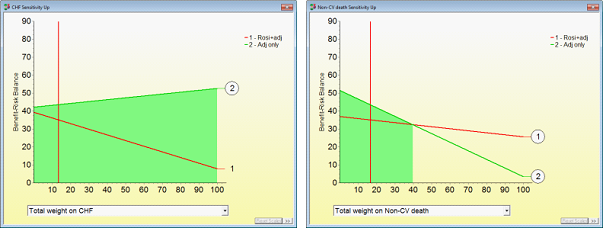
Sensitivity analyses explored the sensitivity of the overall results to changes in weights on the criteria, which were the source of considerable uncertainty on the part of participants, and caused much debate about the balance of benefits and risks. The first analysis examined the weight on the CHF effect. The normalised weight on the model was 13.4, as shown in the right column of the Trade-Off Figure 2. The computer varied that weight over its entire feasible range, 0 to 100, with the result shown in the left figure: whatever the weight, adjunct only remains most preferred.
Uncertainty about the weighting on the MACE node led to a sensitivity analysis; the result is shown in the right Figure 4. A substantial increase in the weight, to nearly 40, is required to tip that balance to the combination. Similar analyses on each criterion showed that the overall balance continued to favour the adjunct alone over a wide range of weights.
Figure 4 "Sensitivity up" analysis
Uncertainty-probabilistic simulation
Like all drugs, rosiglitazone has different effects from one person to the next, so every effect is an uncertain quantity. Thus, using statistical averages of the uncertain quantities could be misleading in an MCDA model; a decision based on the 'average' person doesn't characterise everyone. Therefore, it was necessary to use meta-analysis techniques to provide a quality probability distribution for each of the effects.
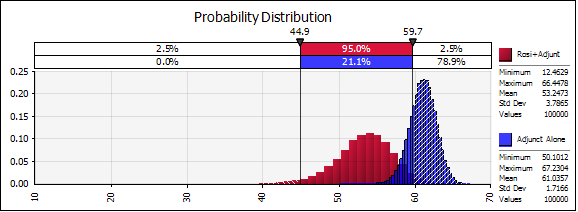
From an initial search over the period from 2000 to 2009, which yielded 32 clinical trials, 22 random controlled trials were chosen, with sample sizes varying from 43 to 2227. Application of statistical techniques that assumed the patients from each trial might have been drawn from different populations provided a means for combining data from the various studies. This approach established a summary probability distribution for each favourable and unfavourable effect, enabling 100,000 combinations of effects to be generated from the MCDA model. The red distribution in Figure 5 shows the benefit-risk probability distribution for rosiglitazone combined with metformin, the blue one for metformin alone:
Figure 5 Probability distributions of rosiglitazone+adjunct versus adjunct alone
Note that the means of the two distributions, 53 and 61, are larger than the final results from the decision conferences, 35 and 43, for rosiglitazone plus metformin and metformin alone. The eight-point difference was the same, but the larger figures are the result of considering 22 studies, only some of which were initially known to participants.
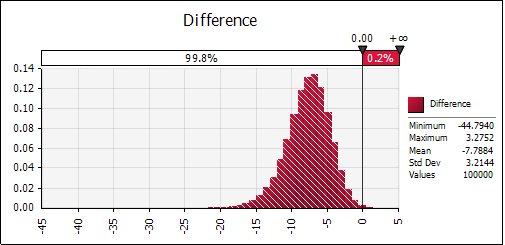
Although most of the blue distribution is to the right of the red one, showing that for most of the 100,000 combinations the benefit-risk balance of metformin alone is better than that of rosiglitazone plus metformin, there is still some overlap, which suggests that the combination might be an improvement. A further 100,000 simulations looked at the difference in benefit-risk between these two distributions (Figure 6), rosiglitazone plus metformin's distribution minus the distribution of metformin alone:
Figure 6 Distribution of the difference between alternatives
The overlap in the two distributions appeared in only 0.2% of the 100,000 simulations, leaving the conclusion that there is a 99.8% chance that the benefit-risk balance for metformin alone is better than that of rosiglitazone plus metformin. Why was such a definitive result obtained? Simply because the joint probability of an event in the right tail of the red distribution and in the left tail of the blue distribution is very small, so happened very infrequently.
Risk Attitude
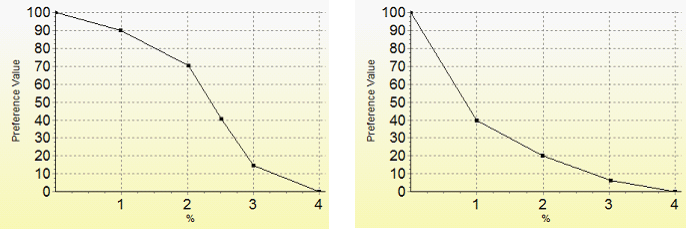
Clinicians participating in the workshop asked to explore the effects of non-linear value functions for some of the unfavourable effects. Two are shown in Figure 7, the left for CHF, and the right for Non-CV deaths.
Figure 7 Value functions
The left value function represents the clinicians' judgement that a 1% increase in the percentage of people experiencing CHF would be slightly worse than nobody experiencing CHF, an increase to 2% would decrease their preference value by another 10-points, an increase to 3% would be much more serious (a drop of 55 points), followed by a 15-point drop to 4%. Although still unsure about this, the clinicians judged Figure 17 to be a plausible non-linear function. The result of this inverted S-shaped value function was to increase the gap in overall preference values from 8 to 11 points, thus adding weight to the conclusion that metformin alone was the preferred alternative. The right convex value function also increased the difference in overall weighted preference value to 11 points.
Linked Decisions
In November 2013, the FDA lifted restrictions on rosiglitazone because new safety data showed that the drug did not raise the chance of a heart attack. Would this new evidence change the results of the PROTECT model? No information was reported about rosiglitazone in combination with metformin, but a 'what if' analysis carried out shortly after the FDA announcement assumed a reduction of the percentage of people experiencing heart attacks from 3.69 in the model to 1.89, the same value as metformin alone. This reduction lessened the overall weighted difference between the options, but metformin alone remained as overall more preferred. So, it is unlikely that the new heart attack data could change the decision between the two options.